29
/
en
AIzaSyAYiBZKx7MnpbEhh9jyipgxe19OcubqV5w
April 1, 2024
213184
Nigeria
NGA
true
2
1
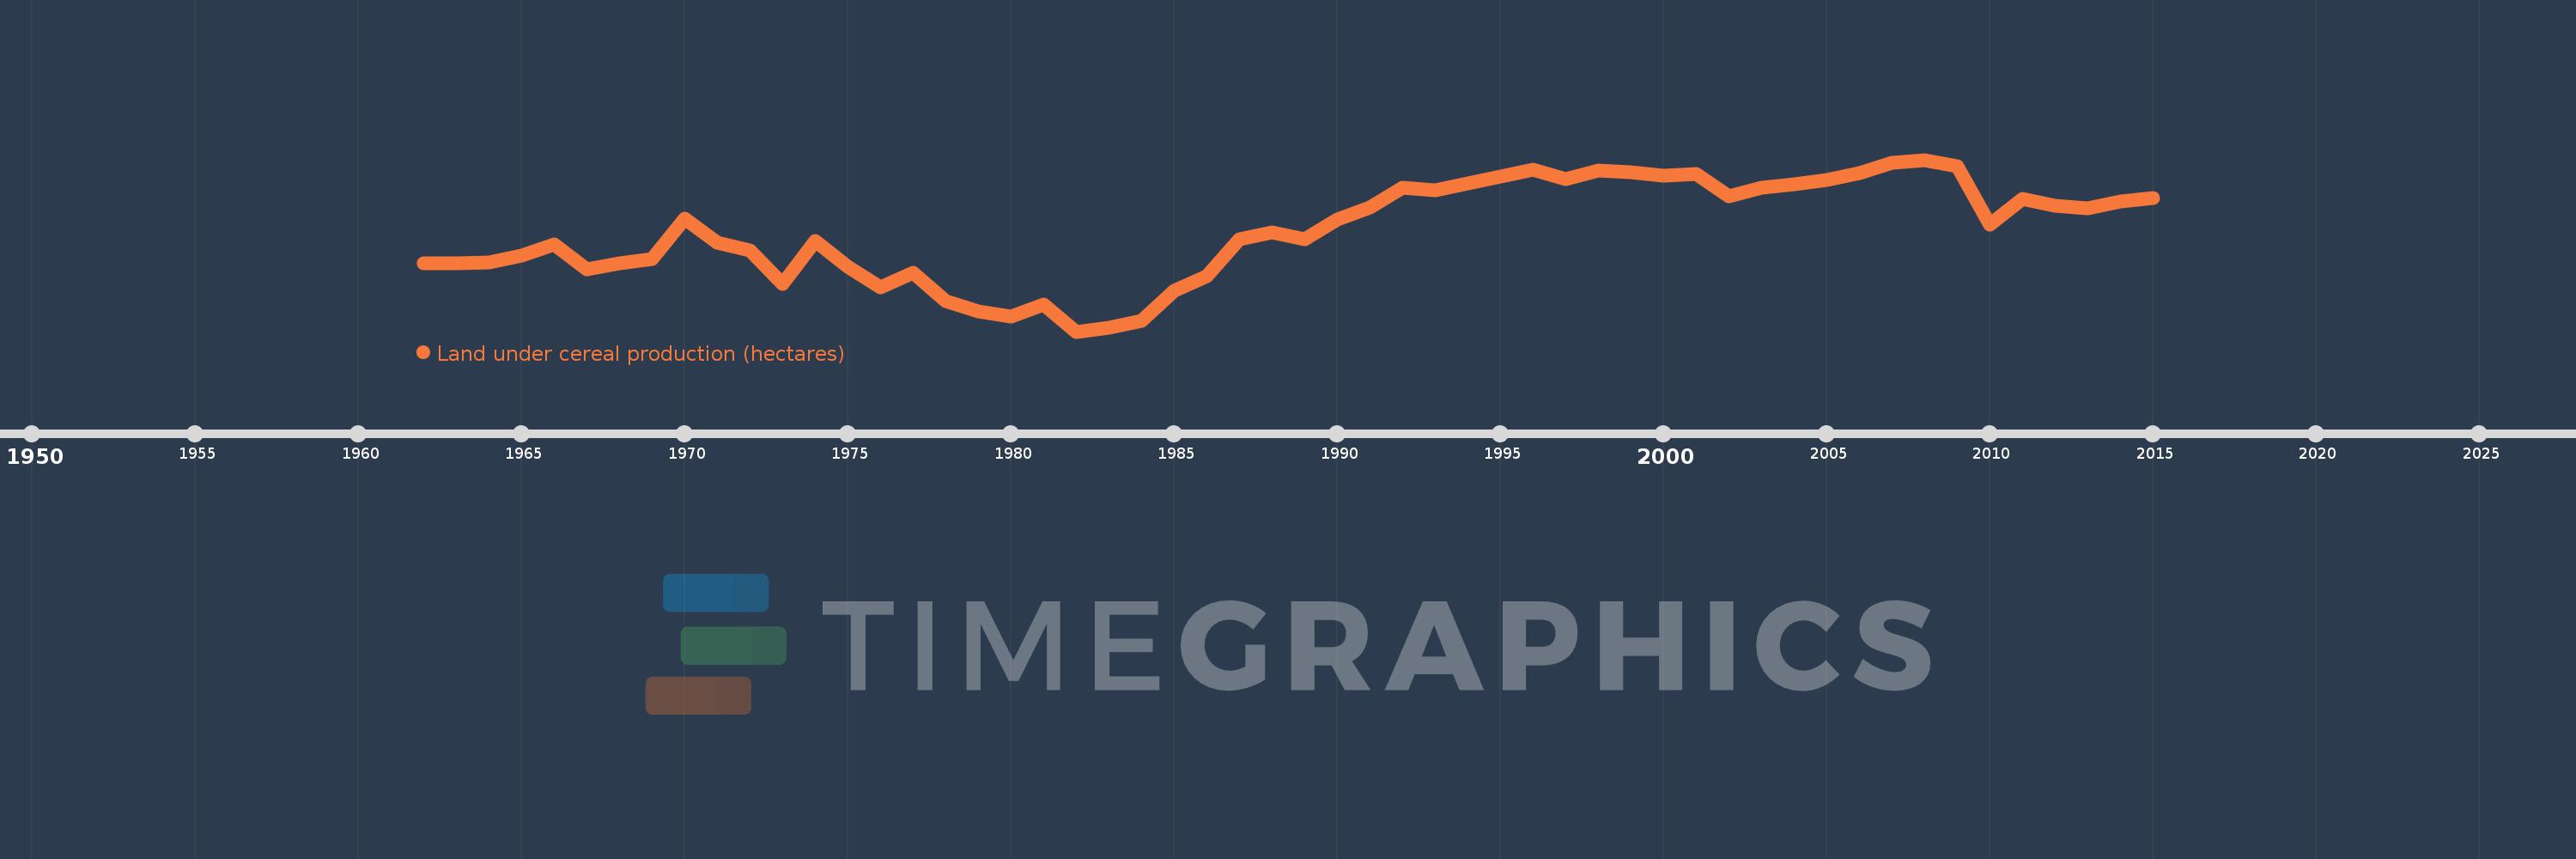
Land under cereal production (hectares)
2015,2014,2013,2012,2011,2010,2009,2008,2007,2006,2005,2004,2003,2002,2001,2000,1999,1998,1997,1996,1995,1994,1993,1992,1991,1990,1989,1988,1987,1986,1985,1984,1983,1982,1981,1980,1979,1978,1977,1976,1975,1974,1973,1972,1971,1970,1969,1968,1967,1966,1965,1964,1963,1962
This statistics in other country:
AfghanistanAlbaniaAlgeriaAngolaAntigua and BarbudaArab WorldArgentinaArmeniaAustraliaAustriaAzerbaijanBahamas, TheBangladeshBarbadosBelarusBelgiumBelizeBeninBhutanBoliviaBosnia and HerzegovinaBotswanaBrazilBrunei DarussalamBulgariaBurkina FasoBurundiCabo VerdeCambodiaCameroonCanadaCaribbean small statesCentral African RepublicCentral Europe and the BalticsChadChileChinaColombiaComorosCongo, Dem. Rep.Congo, Rep.Costa RicaCote d'IvoireCroatiaCubaCyprusCzech RepublicDenmarkDjiboutiDominicaDominican RepublicEarly-demographic dividendEast Asia & PacificEast Asia & Pacific (excluding high income)East Asia & Pacific (IDA & IBRD countries)EcuadorEgypt, Arab Rep.El SalvadorEritreaEstoniaEthiopiaEuro areaEurope & Central AsiaEurope & Central Asia (excluding high income)Europe & Central Asia (IDA & IBRD countries)European UnionFijiFinlandFragile and conflict affected situationsFranceGabonGambia, TheGeorgiaGermanyGhanaGreeceGrenadaGuamGuatemalaGuineaGuinea-BissauGuyanaHaitiHeavily indebted poor countries (HIPC)High incomeHondurasHong Kong SAR, ChinaHungaryIBRD onlyIDA & IBRD totalIDA blendIDA onlyIDA totalIndiaIndonesiaIran, Islamic Rep.IraqIrelandIsraelItalyJamaicaJapanJordanKazakhstanKenyaKorea, Dem. People’s Rep.Korea, Rep.KuwaitKyrgyz RepublicLao PDRLate-demographic dividendLatin America & Caribbean Latin America & Caribbean (excluding high income)Latin America & the Caribbean (IDA & IBRD countries)LatviaLeast developed countries: UN classificationLebanonLesothoLiberiaLibyaLithuaniaLow & middle incomeLow incomeLower middle incomeLuxembourgMacedonia, FYRMadagascarMalawiMalaysiaMaldivesMaliMaltaMauritaniaMauritiusMexicoMicronesia, Fed. Sts.Middle East & North AfricaMiddle East & North Africa (excluding high income)Middle East & North Africa (IDA & IBRD countries)Middle incomeMoldovaMongoliaMontenegroMoroccoMozambiqueMyanmarNamibiaNepalNetherlandsNew CaledoniaNew ZealandNicaraguaNigerNigeriaNorth AmericaNorwayOECD membersOmanOther small statesPacific island small statesPakistanPanamaPapua New GuineaParaguayPeruPhilippinesPolandPortugalPost-demographic dividendPre-demographic dividendPuerto RicoQatarRomaniaRussian FederationRwandaSao Tome and PrincipeSaudi ArabiaSenegalSerbiaSierra LeoneSlovak RepublicSloveniaSmall statesSolomon IslandsSomaliaSouth AfricaSouth AsiaSouth Asia (IDA & IBRD)South SudanSpainSri LankaSt. LuciaSt. Vincent and the GrenadinesSub-Saharan Africa Sub-Saharan Africa (excluding high income)Sub-Saharan Africa (IDA & IBRD countries)SudanSurinameSwazilandSwedenSwitzerlandSyrian Arab RepublicTajikistanTanzaniaThailandTimor-LesteTogoTrinidad and TobagoTunisiaTurkeyTurkmenistanUgandaUkraineUnited Arab EmiratesUnited KingdomUnited StatesUpper middle incomeUruguayUzbekistanVanuatuVenezuela, RBVietnamWest Bank and GazaWorldYemen, Rep.ZambiaZimbabwe Timeline:
This timeline shows a graph from 1962 to 2015 of Nigeria. No data until 1961. Number of actual observations by date: 54.
Source name:
World Development Indicators
Source organization:
Food and Agriculture Organization, electronic files and web site.
Categories, topics:
Agriculture & Rural Development
Last updated:
apr 23, 2017
Indicators value changes by year
Minimum:
4.864 mln
jan 1, 1982
Maximum:
19.41 mln
jan 1, 2008
At the date of observation
Value
Absolute change
Change from previous value
jan 1, 1962
10.621 mln
+10.621 mln
0.0%
jan 1, 1963
10.634 mln
+13.0K
0.12%
jan 1, 1964
10.741 mln
+107.0K
1.01%
jan 1, 1965
11.291 mln
+550.0K
5.12%
jan 1, 1966
12.245 mln
+954.0K
8.45%
jan 1, 1967
10.102 mln
-2.143 mln
-17.5%
jan 1, 1968
10.635 mln
+533.0K
5.28%
jan 1, 1969
11.039 mln
+404.0K
3.8%
jan 1, 1970
14.4 mln
+3.361 mln
30.45%
jan 1, 1971
12.424 mln
-1.976 mln
-13.72%
jan 1, 1972
11.736 mln
-687.5K
-5.53%
jan 1, 1973
8.87 mln
-2.867 mln
-24.43%
jan 1, 1974
12.505 mln
+3.635 mln
40.98%
jan 1, 1975
10.325 mln
-2.179 mln
-17.43%
jan 1, 1976
8.632 mln
-1.693 mln
-16.4%
jan 1, 1977
9.874 mln
+1.242 mln
14.39%
jan 1, 1978
7.46 mln
-2.414 mln
-24.45%
jan 1, 1979
6.554 mln
-906.0K
-12.14%
jan 1, 1980
6.113 mln
-441.0K
-6.73%
jan 1, 1981
7.165 mln
+1.052 mln
17.21%
jan 1, 1982
4.864 mln
-2.3 mln
-32.11%
jan 1, 1983
5.186 mln
+321.5K
6.61%
jan 1, 1984
5.785 mln
+599.0K
11.55%
jan 1, 1985
8.294 mln
+2.509 mln
43.37%
jan 1, 1986
9.527 mln
+1.233 mln
14.87%
jan 1, 1987
12.675 mln
+3.148 mln
33.04%
jan 1, 1988
13.231 mln
+556.0K
4.39%
jan 1, 1989
12.685 mln
-546.0K
-4.13%
jan 1, 1990
14.373 mln
+1.688 mln
13.3%
jan 1, 1991
15.4 mln
+1.027 mln
7.15%
jan 1, 1992
17.014 mln
+1.614 mln
10.48%
jan 1, 1993
16.836 mln
-178.0K
-1.05%
jan 1, 1994
17.424 mln
+587.7K
3.49%
jan 1, 1995
17.993 mln
+569.3K
3.27%
jan 1, 1996
18.598 mln
+605.0K
3.36%
jan 1, 1997
17.753 mln
-845.4K
-4.55%
jan 1, 1998
18.476 mln
+723.4K
4.07%
jan 1, 1999
18.339 mln
-137.0K
-0.74%
jan 1, 2000
18.079 mln
-259.8K
-1.42%
jan 1, 2001
18.242 mln
+162.8K
0.9%
jan 1, 2002
16.286 mln
-1.956 mln
-10.72%
jan 1, 2003
17.027 mln
+741.0K
4.55%
jan 1, 2004
17.371 mln
+344.0K
2.02%
jan 1, 2005
17.716 mln
+345.0K
1.99%
jan 1, 2006
18.31 mln
+594.0K
3.35%
jan 1, 2007
19.147 mln
+837.0K
4.57%
jan 1, 2008
19.41 mln
+263.0K
1.37%
jan 1, 2009
18.899 mln
-511.0K
-2.63%
jan 1, 2010
13.89 mln
-5.009 mln
-26.5%
jan 1, 2011
16.137 mln
+2.247 mln
16.17%
jan 1, 2012
15.511 mln
-625.876K
-3.88%
jan 1, 2013
15.305 mln
-206.04K
-1.33%
jan 1, 2014
15.886 mln
+580.713K
3.79%
jan 1, 2015
16.209 mln
+323.949K
2.04%
Ranking of countries by current statistics by years


Comments: