29
/
en
AIzaSyAYiBZKx7MnpbEhh9jyipgxe19OcubqV5w
April 1, 2024
100136
Cameroon
CMR
true
2
1
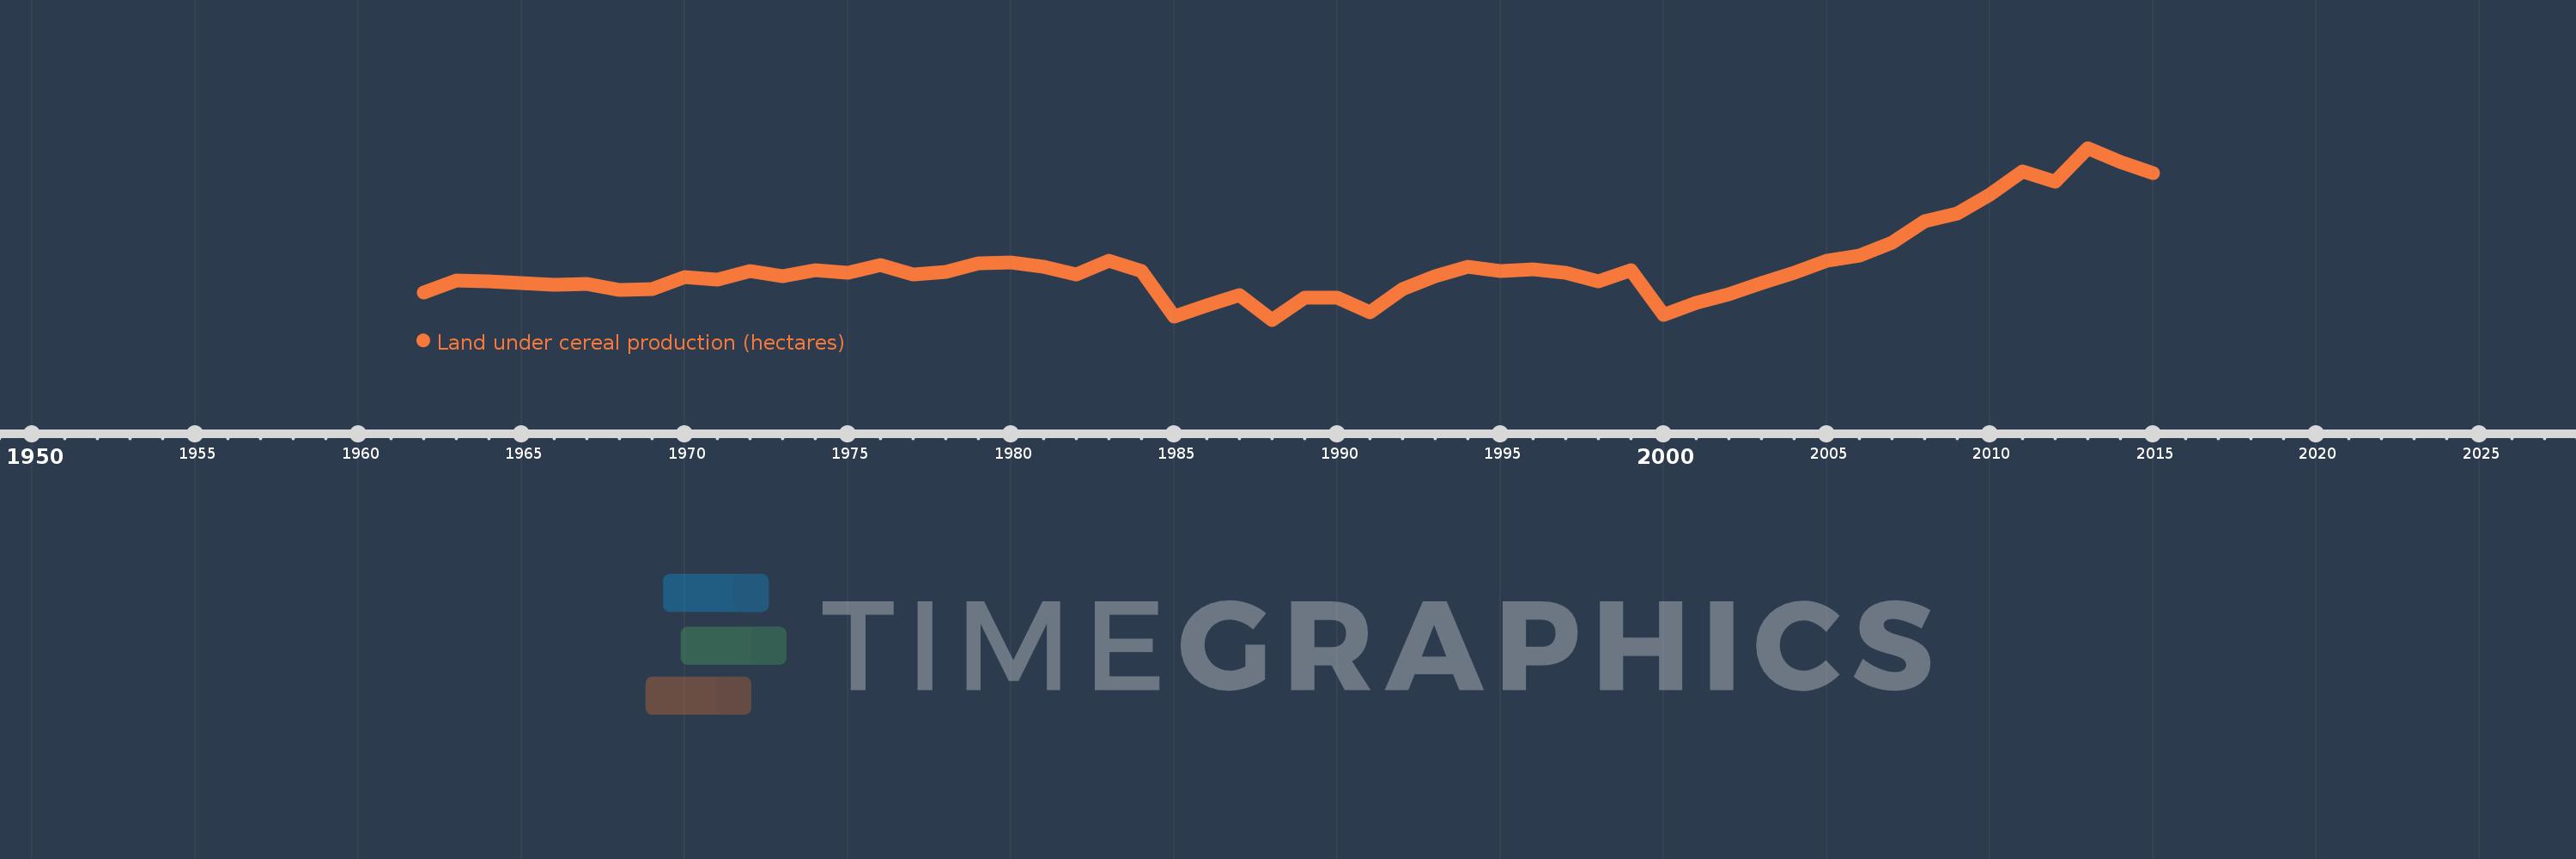
Land under cereal production (hectares)
2015,2014,2013,2012,2011,2010,2009,2008,2007,2006,2005,2004,2003,2002,2001,2000,1999,1998,1997,1996,1995,1994,1993,1992,1991,1990,1989,1988,1987,1986,1985,1984,1983,1982,1981,1980,1979,1978,1977,1976,1975,1974,1973,1972,1971,1970,1969,1968,1967,1966,1965,1964,1963,1962
This statistics in other country:
AfghanistanAlbaniaAlgeriaAngolaAntigua and BarbudaArab WorldArgentinaArmeniaAustraliaAustriaAzerbaijanBahamas, TheBangladeshBarbadosBelarusBelgiumBelizeBeninBhutanBoliviaBosnia and HerzegovinaBotswanaBrazilBrunei DarussalamBulgariaBurkina FasoBurundiCabo VerdeCambodiaCameroonCanadaCaribbean small statesCentral African RepublicCentral Europe and the BalticsChadChileChinaColombiaComorosCongo, Dem. Rep.Congo, Rep.Costa RicaCote d'IvoireCroatiaCubaCyprusCzech RepublicDenmarkDjiboutiDominicaDominican RepublicEarly-demographic dividendEast Asia & PacificEast Asia & Pacific (excluding high income)East Asia & Pacific (IDA & IBRD countries)EcuadorEgypt, Arab Rep.El SalvadorEritreaEstoniaEthiopiaEuro areaEurope & Central AsiaEurope & Central Asia (excluding high income)Europe & Central Asia (IDA & IBRD countries)European UnionFijiFinlandFragile and conflict affected situationsFranceGabonGambia, TheGeorgiaGermanyGhanaGreeceGrenadaGuamGuatemalaGuineaGuinea-BissauGuyanaHaitiHeavily indebted poor countries (HIPC)High incomeHondurasHong Kong SAR, ChinaHungaryIBRD onlyIDA & IBRD totalIDA blendIDA onlyIDA totalIndiaIndonesiaIran, Islamic Rep.IraqIrelandIsraelItalyJamaicaJapanJordanKazakhstanKenyaKorea, Dem. People’s Rep.Korea, Rep.KuwaitKyrgyz RepublicLao PDRLate-demographic dividendLatin America & Caribbean Latin America & Caribbean (excluding high income)Latin America & the Caribbean (IDA & IBRD countries)LatviaLeast developed countries: UN classificationLebanonLesothoLiberiaLibyaLithuaniaLow & middle incomeLow incomeLower middle incomeLuxembourgMacedonia, FYRMadagascarMalawiMalaysiaMaldivesMaliMaltaMauritaniaMauritiusMexicoMicronesia, Fed. Sts.Middle East & North AfricaMiddle East & North Africa (excluding high income)Middle East & North Africa (IDA & IBRD countries)Middle incomeMoldovaMongoliaMontenegroMoroccoMozambiqueMyanmarNamibiaNepalNetherlandsNew CaledoniaNew ZealandNicaraguaNigerNigeriaNorth AmericaNorwayOECD membersOmanOther small statesPacific island small statesPakistanPanamaPapua New GuineaParaguayPeruPhilippinesPolandPortugalPost-demographic dividendPre-demographic dividendPuerto RicoQatarRomaniaRussian FederationRwandaSao Tome and PrincipeSaudi ArabiaSenegalSerbiaSierra LeoneSlovak RepublicSloveniaSmall statesSolomon IslandsSomaliaSouth AfricaSouth AsiaSouth Asia (IDA & IBRD)South SudanSpainSri LankaSt. LuciaSt. Vincent and the GrenadinesSub-Saharan Africa Sub-Saharan Africa (excluding high income)Sub-Saharan Africa (IDA & IBRD countries)SudanSurinameSwazilandSwedenSwitzerlandSyrian Arab RepublicTajikistanTanzaniaThailandTimor-LesteTogoTrinidad and TobagoTunisiaTurkeyTurkmenistanUgandaUkraineUnited Arab EmiratesUnited KingdomUnited StatesUpper middle incomeUruguayUzbekistanVanuatuVenezuela, RBVietnamWest Bank and GazaWorldYemen, Rep.ZambiaZimbabwe Timeline:
This timeline shows a graph from 1962 to 2015 of Cameroon. No data until 1961. Number of actual observations by date: 54.
Source name:
World Development Indicators
Source organization:
Food and Agriculture Organization, electronic files and web site.
Categories, topics:
Agriculture & Rural Development
Last updated:
apr 23, 2017
Indicators value changes by year
Minimum:
582.102K
jan 1, 1988
Maximum:
2.029 mln
jan 1, 2013
At the date of observation
Value
Absolute change
Change from previous value
jan 1, 1962
814.452K
+814.452K
0.0%
jan 1, 1963
909.688K
+95.236K
11.69%
jan 1, 1964
903.695K
-5.993K
-0.66%
jan 1, 1965
887.702K
-15.993K
-1.77%
jan 1, 1966
875.932K
-11.77K
-1.33%
jan 1, 1967
884.051K
+8.119K
0.93%
jan 1, 1968
830.487K
-53.564K
-6.06%
jan 1, 1969
838.21K
+7.723K
0.93%
jan 1, 1970
939.792K
+101.582K
12.12%
jan 1, 1971
923.573K
-16.219K
-1.73%
jan 1, 1972
992.652K
+69.079K
7.48%
jan 1, 1973
948.409K
-44.243K
-4.46%
jan 1, 1974
998.927K
+50.518K
5.33%
jan 1, 1975
975.229K
-23.698K
-2.37%
jan 1, 1976
1.043 mln
+67.287K
6.9%
jan 1, 1977
964.175K
-78.341K
-7.51%
jan 1, 1978
981.715K
+17.54K
1.82%
jan 1, 1979
1.061 mln
+78.966K
8.04%
jan 1, 1980
1.067 mln
+5.901K
0.56%
jan 1, 1981
1.032 mln
-34.852K
-3.27%
jan 1, 1982
964.842K
-66.888K
-6.48%
jan 1, 1983
1.08 mln
+114.79K
11.9%
jan 1, 1984
992.687K
-86.945K
-8.05%
jan 1, 1985
610.628K
-382.059K
-38.49%
jan 1, 1986
706.454K
+95.826K
15.69%
jan 1, 1987
792.237K
+85.783K
12.14%
jan 1, 1988
582.102K
-210.135K
-26.52%
jan 1, 1989
771.621K
+189.519K
32.56%
jan 1, 1990
766.751K
-4.87K
-0.63%
jan 1, 1991
648.236K
-118.515K
-15.46%
jan 1, 1992
843.688K
+195.452K
30.15%
jan 1, 1993
950.472K
+106.784K
12.66%
jan 1, 1994
1.028 mln
+78.007K
8.21%
jan 1, 1995
991.81K
-36.669K
-3.57%
jan 1, 1996
1.007 mln
+14.804K
1.49%
jan 1, 1997
974.872K
-31.742K
-3.15%
jan 1, 1998
905.353K
-69.519K
-7.13%
jan 1, 1999
1.003 mln
+97.684K
10.79%
jan 1, 2000
626.07K
-376.967K
-37.58%
jan 1, 2001
723.039K
+96.969K
15.49%
jan 1, 2002
793.656K
+70.617K
9.77%
jan 1, 2003
890.775K
+97.119K
12.24%
jan 1, 2004
979.737K
+88.962K
9.99%
jan 1, 2005
1.078 mln
+97.908K
9.99%
jan 1, 2006
1.122 mln
+44.645K
4.14%
jan 1, 2007
1.233 mln
+110.494K
9.85%
jan 1, 2008
1.413 mln
+180.127K
14.61%
jan 1, 2009
1.474 mln
+61.096K
4.32%
jan 1, 2010
1.637 mln
+162.971K
11.06%
jan 1, 2011
1.834 mln
+196.707K
12.02%
jan 1, 2012
1.744 mln
-89.248K
-4.87%
jan 1, 2013
2.029 mln
+284.694K
16.32%
jan 1, 2014
1.908 mln
-121.467K
-5.99%
jan 1, 2015
1.814 mln
-93.965K
-4.93%
Ranking of countries by current statistics by years


Comments: