29
/
en
AIzaSyAYiBZKx7MnpbEhh9jyipgxe19OcubqV5w
April 1, 2024
28287
East Asia & Pacific (excluding high income)
EAP
false
2
1
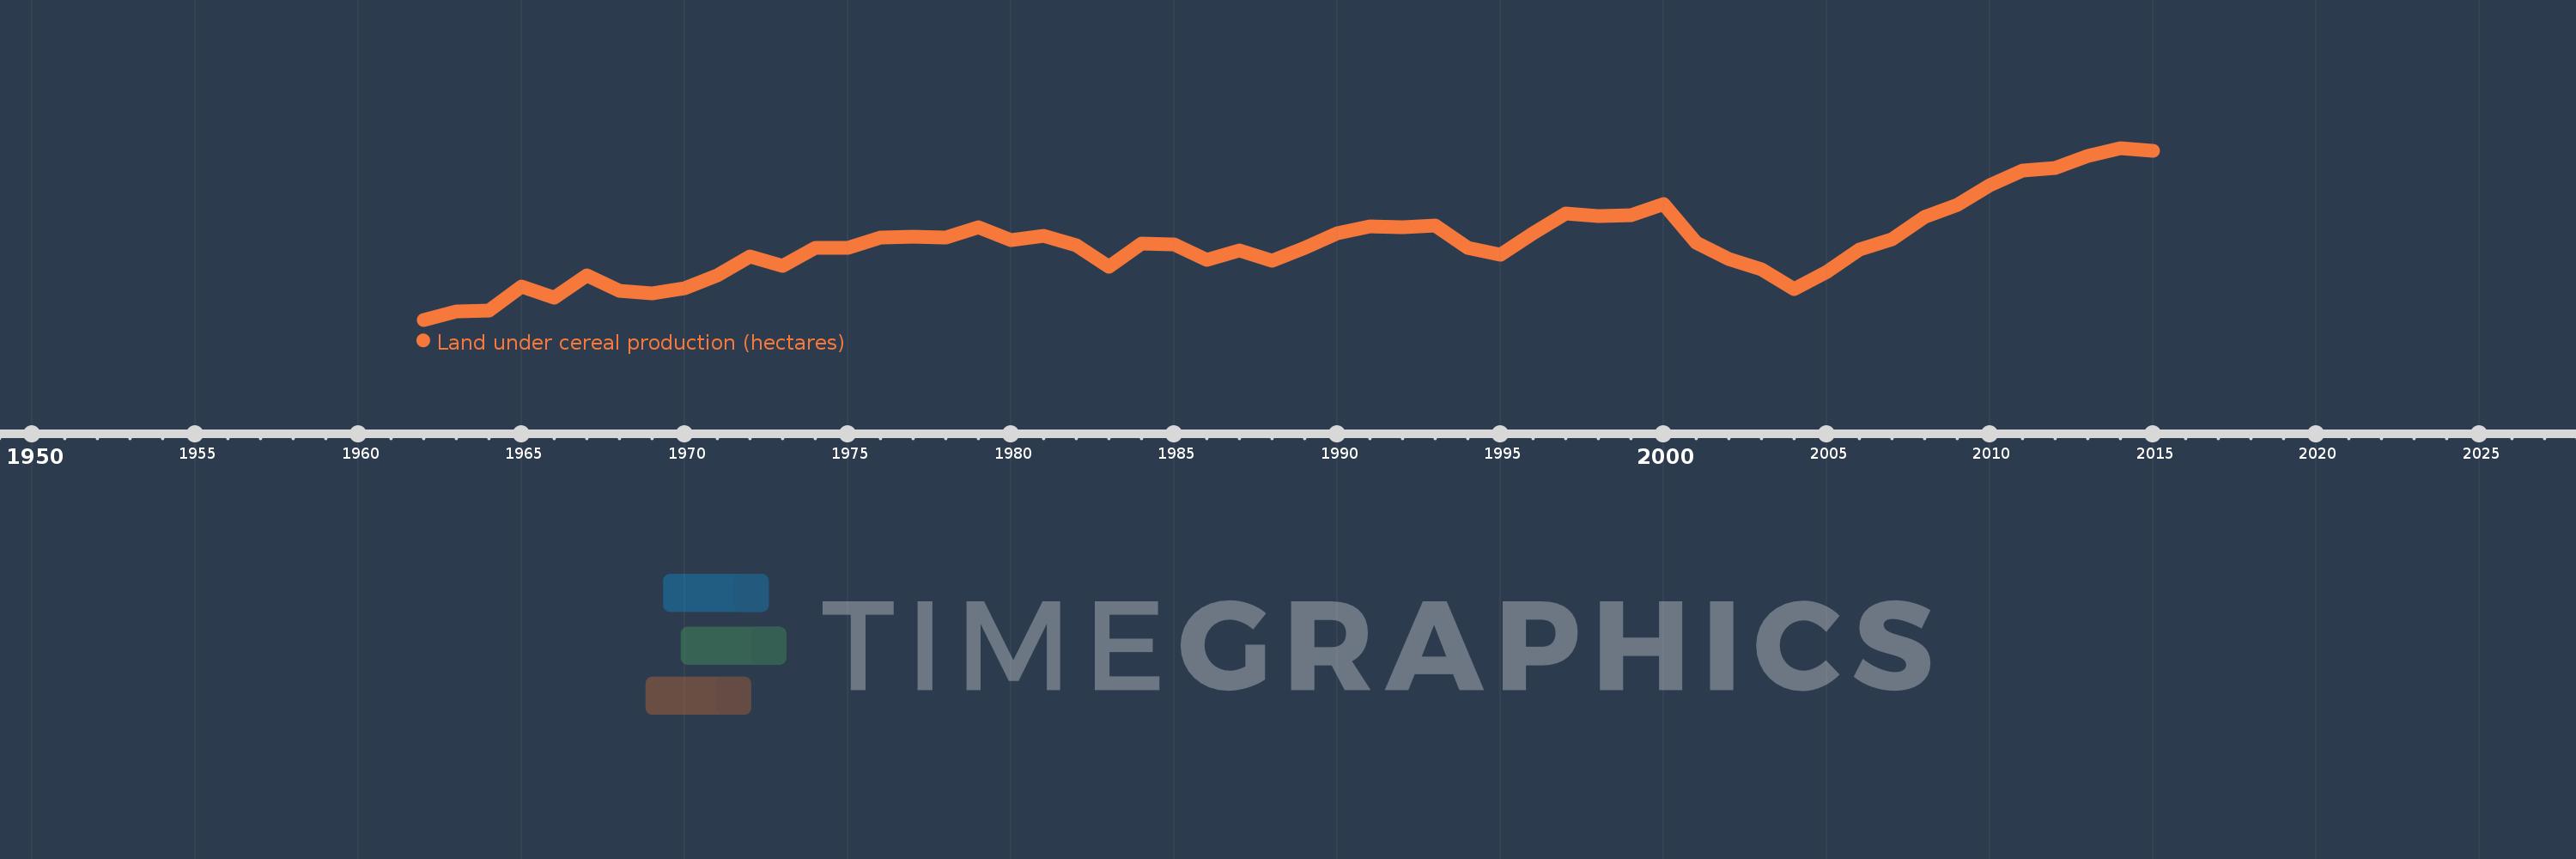
Land under cereal production (hectares)
2015,2014,2013,2012,2011,2010,2009,2008,2007,2006,2005,2004,2003,2002,2001,2000,1999,1998,1997,1996,1995,1994,1993,1992,1991,1990,1989,1988,1987,1986,1985,1984,1983,1982,1981,1980,1979,1978,1977,1976,1975,1974,1973,1972,1971,1970,1969,1968,1967,1966,1965,1964,1963,1962
This statistics in other country:
AfghanistanAlbaniaAlgeriaAngolaAntigua and BarbudaArab WorldArgentinaArmeniaAustraliaAustriaAzerbaijanBahamas, TheBangladeshBarbadosBelarusBelgiumBelizeBeninBhutanBoliviaBosnia and HerzegovinaBotswanaBrazilBrunei DarussalamBulgariaBurkina FasoBurundiCabo VerdeCambodiaCameroonCanadaCaribbean small statesCentral African RepublicCentral Europe and the BalticsChadChileChinaColombiaComorosCongo, Dem. Rep.Congo, Rep.Costa RicaCote d'IvoireCroatiaCubaCyprusCzech RepublicDenmarkDjiboutiDominicaDominican RepublicEarly-demographic dividendEast Asia & PacificEast Asia & Pacific (excluding high income)East Asia & Pacific (IDA & IBRD countries)EcuadorEgypt, Arab Rep.El SalvadorEritreaEstoniaEthiopiaEuro areaEurope & Central AsiaEurope & Central Asia (excluding high income)Europe & Central Asia (IDA & IBRD countries)European UnionFijiFinlandFragile and conflict affected situationsFranceGabonGambia, TheGeorgiaGermanyGhanaGreeceGrenadaGuamGuatemalaGuineaGuinea-BissauGuyanaHaitiHeavily indebted poor countries (HIPC)High incomeHondurasHong Kong SAR, ChinaHungaryIBRD onlyIDA & IBRD totalIDA blendIDA onlyIDA totalIndiaIndonesiaIran, Islamic Rep.IraqIrelandIsraelItalyJamaicaJapanJordanKazakhstanKenyaKorea, Dem. People’s Rep.Korea, Rep.KuwaitKyrgyz RepublicLao PDRLate-demographic dividendLatin America & Caribbean Latin America & Caribbean (excluding high income)Latin America & the Caribbean (IDA & IBRD countries)LatviaLeast developed countries: UN classificationLebanonLesothoLiberiaLibyaLithuaniaLow & middle incomeLow incomeLower middle incomeLuxembourgMacedonia, FYRMadagascarMalawiMalaysiaMaldivesMaliMaltaMauritaniaMauritiusMexicoMicronesia, Fed. Sts.Middle East & North AfricaMiddle East & North Africa (excluding high income)Middle East & North Africa (IDA & IBRD countries)Middle incomeMoldovaMongoliaMontenegroMoroccoMozambiqueMyanmarNamibiaNepalNetherlandsNew CaledoniaNew ZealandNicaraguaNigerNigeriaNorth AmericaNorwayOECD membersOmanOther small statesPacific island small statesPakistanPanamaPapua New GuineaParaguayPeruPhilippinesPolandPortugalPost-demographic dividendPre-demographic dividendPuerto RicoQatarRomaniaRussian FederationRwandaSao Tome and PrincipeSaudi ArabiaSenegalSerbiaSierra LeoneSlovak RepublicSloveniaSmall statesSolomon IslandsSomaliaSouth AfricaSouth AsiaSouth Asia (IDA & IBRD)South SudanSpainSri LankaSt. LuciaSt. Vincent and the GrenadinesSub-Saharan Africa Sub-Saharan Africa (excluding high income)Sub-Saharan Africa (IDA & IBRD countries)SudanSurinameSwazilandSwedenSwitzerlandSyrian Arab RepublicTajikistanTanzaniaThailandTimor-LesteTogoTrinidad and TobagoTunisiaTurkeyTurkmenistanUgandaUkraineUnited Arab EmiratesUnited KingdomUnited StatesUpper middle incomeUruguayUzbekistanVanuatuVenezuela, RBVietnamWest Bank and GazaWorldYemen, Rep.ZambiaZimbabwe Timeline:
This timeline shows a graph from 1962 to 2015 of East Asia & Pacific (excluding high income). No data until 1961. Number of actual observations by date: 54.
Source name:
World Development Indicators
Source organization:
Food and Agriculture Organization, electronic files and web site.
Categories, topics:
Agriculture & Rural Development
Last updated:
apr 23, 2017
Indicators value changes by year
Minimum:
125.382 mln
jan 1, 1962
Maximum:
155.455 mln
jan 1, 2014
At the date of observation
Value
Absolute change
Change from previous value
jan 1, 1962
125.382 mln
+125.382 mln
0.0%
jan 1, 1963
126.901 mln
+1.519 mln
1.21%
jan 1, 1964
126.972 mln
+71.099K
0.06%
jan 1, 1965
131.203 mln
+4.231 mln
3.33%
jan 1, 1966
129.237 mln
-1.967 mln
-1.5%
jan 1, 1967
133.204 mln
+3.967 mln
3.07%
jan 1, 1968
130.422 mln
-2.782 mln
-2.09%
jan 1, 1969
130.051 mln
-370.987K
-0.28%
jan 1, 1970
130.895 mln
+843.624K
0.65%
jan 1, 1971
133.181 mln
+2.286 mln
1.75%
jan 1, 1972
136.441 mln
+3.26 mln
2.45%
jan 1, 1973
134.762 mln
-1.679 mln
-1.23%
jan 1, 1974
137.95 mln
+3.188 mln
2.37%
jan 1, 1975
137.968 mln
+17.417K
0.01%
jan 1, 1976
139.81 mln
+1.843 mln
1.34%
jan 1, 1977
139.948 mln
+137.562K
0.1%
jan 1, 1978
139.699 mln
-248.869K
-0.18%
jan 1, 1979
141.633 mln
+1.934 mln
1.38%
jan 1, 1980
139.3 mln
-2.333 mln
-1.65%
jan 1, 1981
140.125 mln
+825.138K
0.59%
jan 1, 1982
138.382 mln
-1.743 mln
-1.24%
jan 1, 1983
134.634 mln
-3.748 mln
-2.71%
jan 1, 1984
138.655 mln
+4.021 mln
2.99%
jan 1, 1985
138.56 mln
-95.236K
-0.07%
jan 1, 1986
135.919 mln
-2.64 mln
-1.91%
jan 1, 1987
137.533 mln
+1.614 mln
1.19%
jan 1, 1988
135.785 mln
-1.748 mln
-1.27%
jan 1, 1989
138.019 mln
+2.234 mln
1.65%
jan 1, 1990
140.523 mln
+2.504 mln
1.81%
jan 1, 1991
141.693 mln
+1.169 mln
0.83%
jan 1, 1992
141.625 mln
-67.806K
-0.05%
jan 1, 1993
141.928 mln
+302.647K
0.21%
jan 1, 1994
137.93 mln
-3.997 mln
-2.82%
jan 1, 1995
136.801 mln
-1.129 mln
-0.82%
jan 1, 1996
140.482 mln
+3.681 mln
2.69%
jan 1, 1997
143.917 mln
+3.435 mln
2.45%
jan 1, 1998
143.561 mln
-355.843K
-0.25%
jan 1, 1999
143.652 mln
+91.6K
0.06%
jan 1, 2000
145.71 mln
+2.058 mln
1.43%
jan 1, 2001
138.828 mln
-6.882 mln
-4.72%
jan 1, 2002
135.978 mln
-2.85 mln
-2.05%
jan 1, 2003
134.241 mln
-1.737 mln
-1.28%
jan 1, 2004
130.759 mln
-3.482 mln
-2.59%
jan 1, 2005
133.711 mln
+2.952 mln
2.26%
jan 1, 2006
137.721 mln
+4.01 mln
3.0%
jan 1, 2007
139.43 mln
+1.709 mln
1.24%
jan 1, 2008
143.387 mln
+3.958 mln
2.84%
jan 1, 2009
145.497 mln
+2.109 mln
1.47%
jan 1, 2010
148.919 mln
+3.423 mln
2.35%
jan 1, 2011
151.478 mln
+2.558 mln
1.72%
jan 1, 2012
152.027 mln
+548.77K
0.36%
jan 1, 2013
154.109 mln
+2.082 mln
1.37%
jan 1, 2014
155.455 mln
+1.346 mln
0.87%
jan 1, 2015
154.975 mln
-479.499K
-0.31%
Ranking of countries by current statistics by years


Comments: