29
/
en
AIzaSyAYiBZKx7MnpbEhh9jyipgxe19OcubqV5w
April 1, 2024
222417
Peru
PER
true
2
1
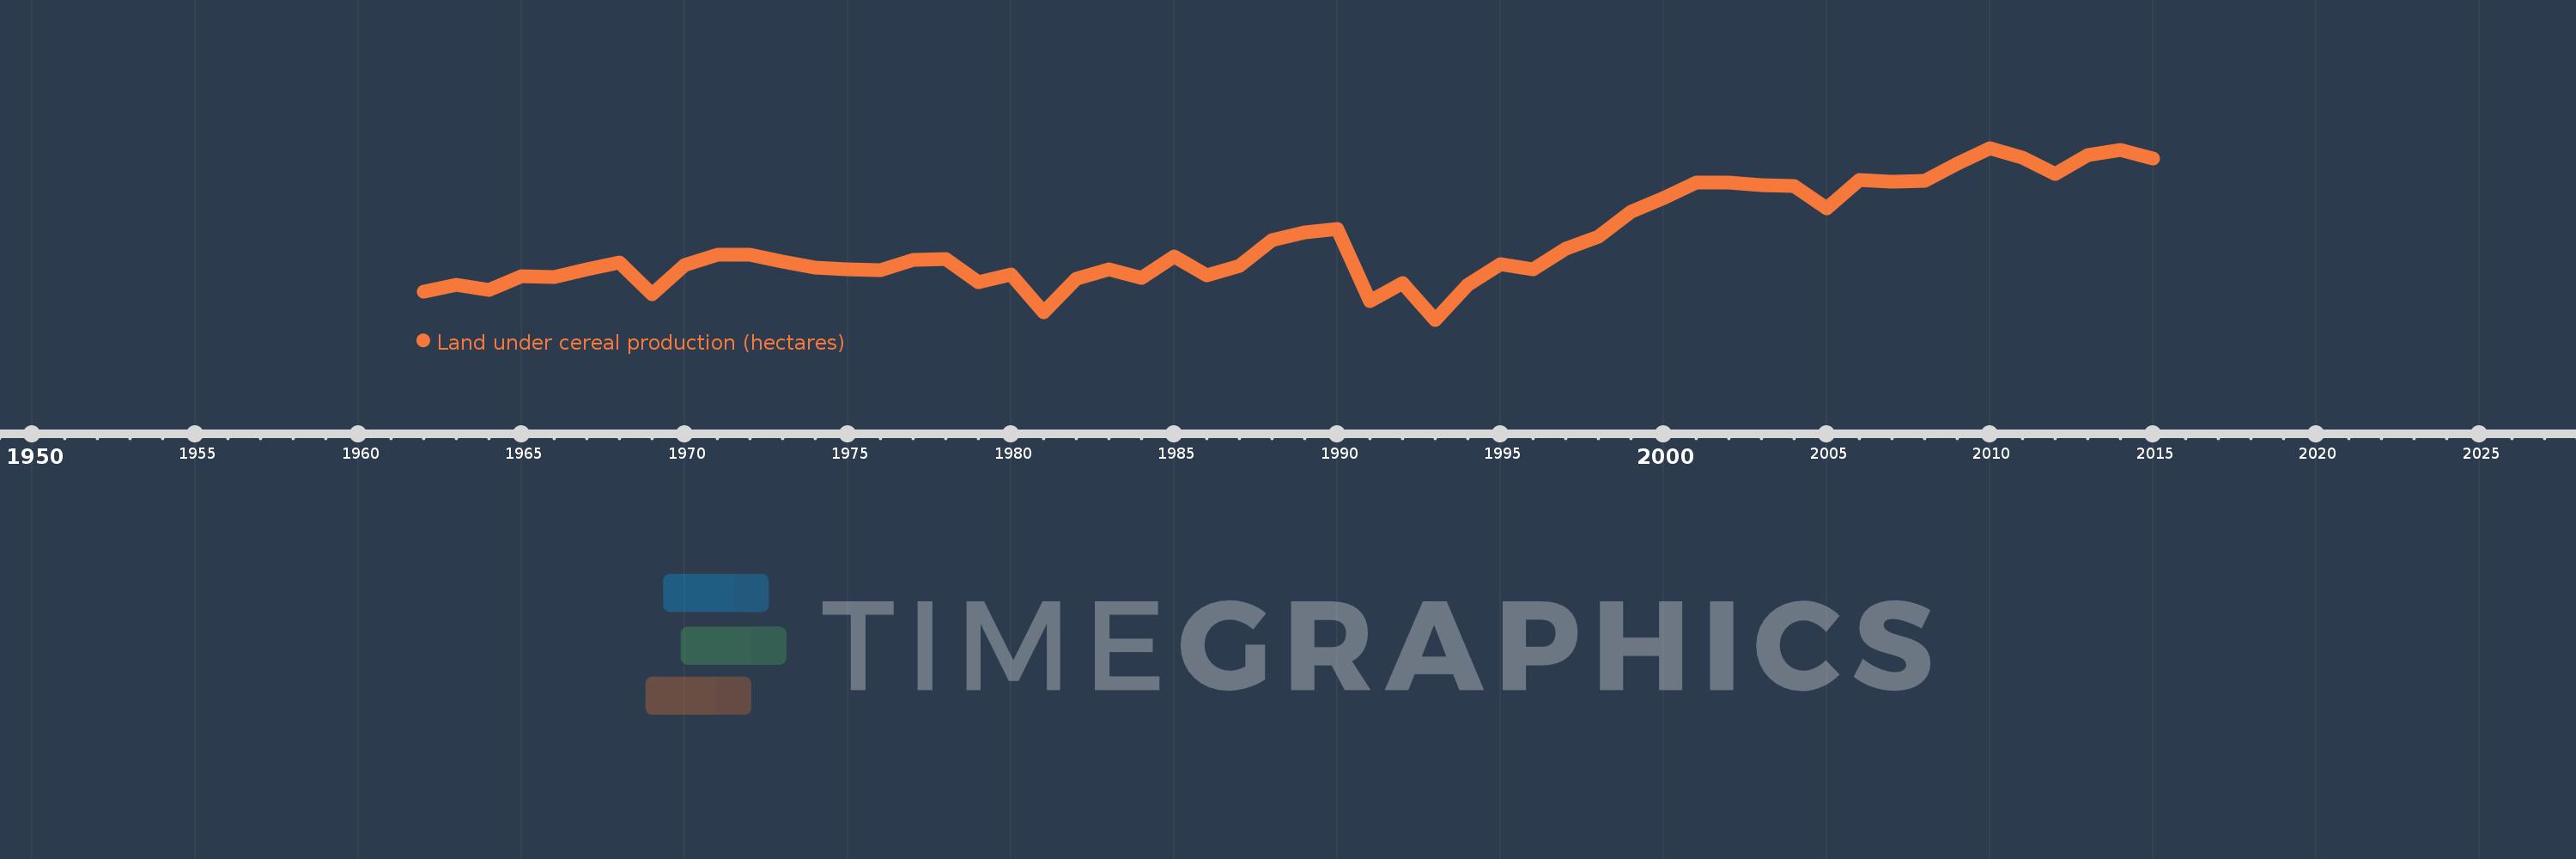
Land under cereal production (hectares)
2015,2014,2013,2012,2011,2010,2009,2008,2007,2006,2005,2004,2003,2002,2001,2000,1999,1998,1997,1996,1995,1994,1993,1992,1991,1990,1989,1988,1987,1986,1985,1984,1983,1982,1981,1980,1979,1978,1977,1976,1975,1974,1973,1972,1971,1970,1969,1968,1967,1966,1965,1964,1963,1962
This statistics in other country:
AfghanistanAlbaniaAlgeriaAngolaAntigua and BarbudaArab WorldArgentinaArmeniaAustraliaAustriaAzerbaijanBahamas, TheBangladeshBarbadosBelarusBelgiumBelizeBeninBhutanBoliviaBosnia and HerzegovinaBotswanaBrazilBrunei DarussalamBulgariaBurkina FasoBurundiCabo VerdeCambodiaCameroonCanadaCaribbean small statesCentral African RepublicCentral Europe and the BalticsChadChileChinaColombiaComorosCongo, Dem. Rep.Congo, Rep.Costa RicaCote d'IvoireCroatiaCubaCyprusCzech RepublicDenmarkDjiboutiDominicaDominican RepublicEarly-demographic dividendEast Asia & PacificEast Asia & Pacific (excluding high income)East Asia & Pacific (IDA & IBRD countries)EcuadorEgypt, Arab Rep.El SalvadorEritreaEstoniaEthiopiaEuro areaEurope & Central AsiaEurope & Central Asia (excluding high income)Europe & Central Asia (IDA & IBRD countries)European UnionFijiFinlandFragile and conflict affected situationsFranceGabonGambia, TheGeorgiaGermanyGhanaGreeceGrenadaGuamGuatemalaGuineaGuinea-BissauGuyanaHaitiHeavily indebted poor countries (HIPC)High incomeHondurasHong Kong SAR, ChinaHungaryIBRD onlyIDA & IBRD totalIDA blendIDA onlyIDA totalIndiaIndonesiaIran, Islamic Rep.IraqIrelandIsraelItalyJamaicaJapanJordanKazakhstanKenyaKorea, Dem. People’s Rep.Korea, Rep.KuwaitKyrgyz RepublicLao PDRLate-demographic dividendLatin America & Caribbean Latin America & Caribbean (excluding high income)Latin America & the Caribbean (IDA & IBRD countries)LatviaLeast developed countries: UN classificationLebanonLesothoLiberiaLibyaLithuaniaLow & middle incomeLow incomeLower middle incomeLuxembourgMacedonia, FYRMadagascarMalawiMalaysiaMaldivesMaliMaltaMauritaniaMauritiusMexicoMicronesia, Fed. Sts.Middle East & North AfricaMiddle East & North Africa (excluding high income)Middle East & North Africa (IDA & IBRD countries)Middle incomeMoldovaMongoliaMontenegroMoroccoMozambiqueMyanmarNamibiaNepalNetherlandsNew CaledoniaNew ZealandNicaraguaNigerNigeriaNorth AmericaNorwayOECD membersOmanOther small statesPacific island small statesPakistanPanamaPapua New GuineaParaguayPeruPhilippinesPolandPortugalPost-demographic dividendPre-demographic dividendPuerto RicoQatarRomaniaRussian FederationRwandaSao Tome and PrincipeSaudi ArabiaSenegalSerbiaSierra LeoneSlovak RepublicSloveniaSmall statesSolomon IslandsSomaliaSouth AfricaSouth AsiaSouth Asia (IDA & IBRD)South SudanSpainSri LankaSt. LuciaSt. Vincent and the GrenadinesSub-Saharan Africa Sub-Saharan Africa (excluding high income)Sub-Saharan Africa (IDA & IBRD countries)SudanSurinameSwazilandSwedenSwitzerlandSyrian Arab RepublicTajikistanTanzaniaThailandTimor-LesteTogoTrinidad and TobagoTunisiaTurkeyTurkmenistanUgandaUkraineUnited Arab EmiratesUnited KingdomUnited StatesUpper middle incomeUruguayUzbekistanVanuatuVenezuela, RBVietnamWest Bank and GazaWorldYemen, Rep.ZambiaZimbabwe Timeline:
This timeline shows a graph from 1962 to 2015 of Peru. No data until 1961. Number of actual observations by date: 54.
Source name:
World Development Indicators
Source organization:
Food and Agriculture Organization, electronic files and web site.
Categories, topics:
Agriculture & Rural Development
Last updated:
apr 23, 2017
Indicators value changes by year
Minimum:
608.66K
jan 1, 1993
Maximum:
1.289 mln
jan 1, 2010
At the date of observation
Value
Absolute change
Change from previous value
jan 1, 1962
719.295K
+719.295K
0.0%
jan 1, 1963
745.816K
+26.521K
3.69%
jan 1, 1964
724.96K
-20.856K
-2.8%
jan 1, 1965
781.75K
+56.79K
7.83%
jan 1, 1966
777.38K
-4.37K
-0.56%
jan 1, 1967
807.95K
+30.57K
3.93%
jan 1, 1968
836.815K
+28.865K
3.57%
jan 1, 1969
709.05K
-127.765K
-15.27%
jan 1, 1970
826.697K
+117.647K
16.59%
jan 1, 1971
867.04K
+40.343K
4.88%
jan 1, 1972
865.29K
-1.75K
-0.2%
jan 1, 1973
839.22K
-26.07K
-3.01%
jan 1, 1974
816.505K
-22.715K
-2.71%
jan 1, 1975
807.755K
-8.75K
-1.07%
jan 1, 1976
806.258K
-1.497K
-0.19%
jan 1, 1977
846.3K
+40.042K
4.97%
jan 1, 1978
848.608K
+2.308K
0.27%
jan 1, 1979
758.571K
-90.037K
-10.61%
jan 1, 1980
786.296K
+27.725K
3.65%
jan 1, 1981
639.839K
-146.457K
-18.63%
jan 1, 1982
770.429K
+130.59K
20.41%
jan 1, 1983
808.35K
+37.921K
4.92%
jan 1, 1984
775.425K
-32.925K
-4.07%
jan 1, 1985
858.155K
+82.73K
10.67%
jan 1, 1986
785.823K
-72.332K
-8.43%
jan 1, 1987
822.03K
+36.207K
4.61%
jan 1, 1988
922.102K
+100.072K
12.17%
jan 1, 1989
954.645K
+32.543K
3.53%
jan 1, 1990
966.781K
+12.136K
1.27%
jan 1, 1991
683.214K
-283.567K
-29.33%
jan 1, 1992
753.094K
+69.88K
10.23%
jan 1, 1993
608.66K
-144.434K
-19.18%
jan 1, 1994
746.777K
+138.117K
22.69%
jan 1, 1995
827.2K
+80.423K
10.77%
jan 1, 1996
807.256K
-19.944K
-2.41%
jan 1, 1997
889.048K
+81.792K
10.13%
jan 1, 1998
937.7K
+48.652K
5.47%
jan 1, 1999
1.034 mln
+96.707K
10.31%
jan 1, 2000
1.092 mln
+57.412K
5.55%
jan 1, 2001
1.152 mln
+60.556K
5.55%
jan 1, 2002
1.153 mln
+693.0
0.06%
jan 1, 2003
1.14 mln
-13.267K
-1.15%
jan 1, 2004
1.139 mln
-1.08K
-0.09%
jan 1, 2005
1.049 mln
-89.834K
-7.89%
jan 1, 2006
1.161 mln
+112.455K
10.72%
jan 1, 2007
1.154 mln
-7.063K
-0.61%
jan 1, 2008
1.157 mln
+2.702K
0.23%
jan 1, 2009
1.226 mln
+68.675K
5.94%
jan 1, 2010
1.289 mln
+62.908K
5.13%
jan 1, 2011
1.249 mln
-39.61K
-3.07%
jan 1, 2012
1.184 mln
-64.61K
-5.17%
jan 1, 2013
1.259 mln
+74.4K
6.28%
jan 1, 2014
1.28 mln
+21.152K
1.68%
jan 1, 2015
1.247 mln
-33.018K
-2.58%
Ranking of countries by current statistics by years


Comments: