29
/it/
it
AIzaSyAYiBZKx7MnpbEhh9jyipgxe19OcubqV5w
April 1, 2024
62551
World
WLD
false
2
1
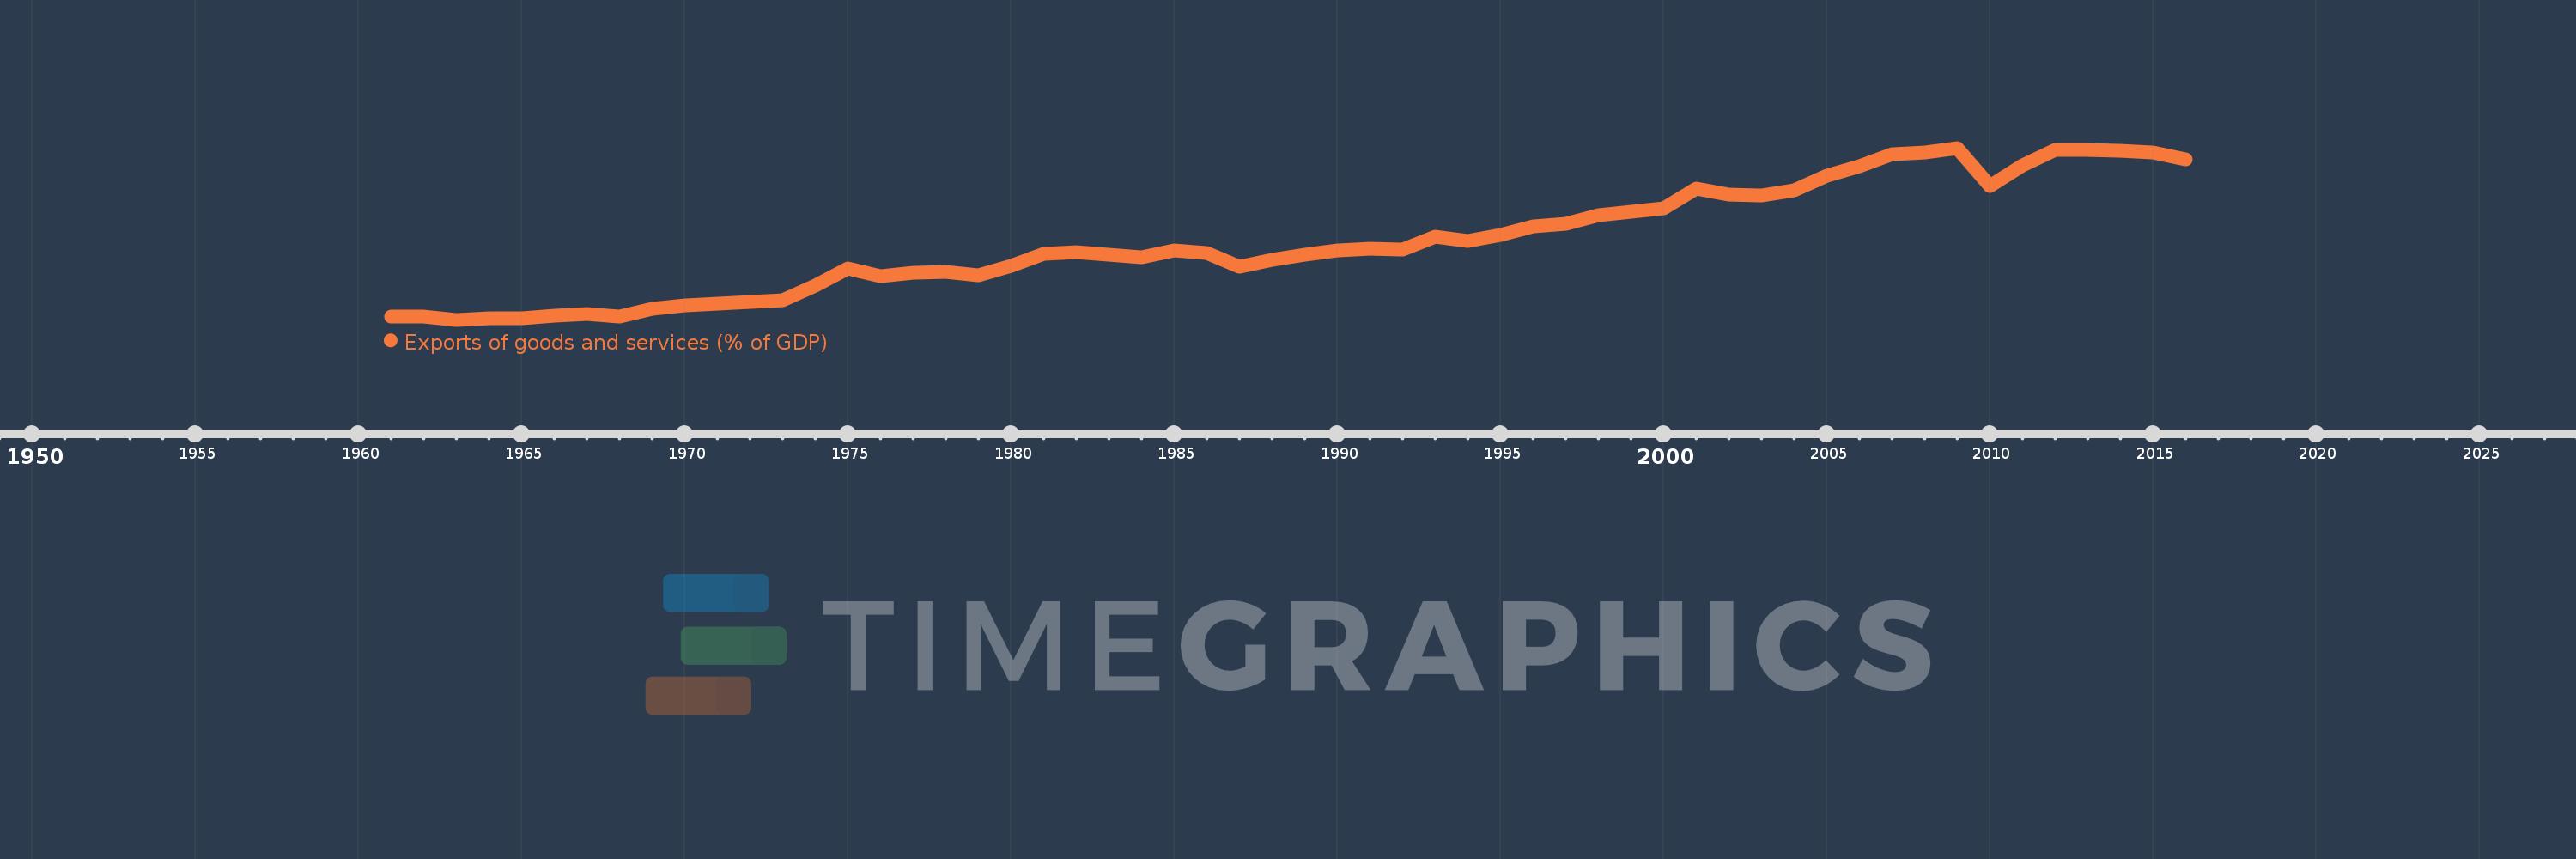
Exports of goods and services (% of GDP)
2016,2015,2014,2013,2012,2011,2010,2009,2008,2007,2006,2005,2004,2003,2002,2001,2000,1999,1998,1997,1996,1995,1994,1993,1992,1991,1990,1989,1988,1987,1986,1985,1984,1983,1982,1981,1980,1979,1978,1977,1976,1975,1974,1973,1972,1971,1970,1969,1968,1967,1966,1965,1964,1963,1962,1961
Queste statistiche in altri paesi:
AfghanistanAlbaniaAlgeriaAngolaAntigua and BarbudaArab WorldArgentinaArmeniaArubaAustraliaAustriaAzerbaijanBahamas, TheBahrainBangladeshBarbadosBelarusBelgiumBelizeBeninBermudaBhutanBoliviaBosnia and HerzegovinaBotswanaBrazilBrunei DarussalamBulgariaBurkina FasoBurundiCabo VerdeCambodiaCameroonCanadaCaribbean small statesCentral African RepublicCentral Europe and the BalticsChadChileChinaColombiaComorosCongo, Dem. Rep.Congo, Rep.Costa RicaCote d'IvoireCroatiaCubaCyprusCzech RepublicDenmarkDjiboutiDominicaDominican RepublicEarly-demographic dividendEast Asia & PacificEast Asia & Pacific (excluding high income)East Asia & Pacific (IDA & IBRD countries)EcuadorEgypt, Arab Rep.El SalvadorEquatorial GuineaEritreaEstoniaEthiopiaEuro areaEurope & Central AsiaEurope & Central Asia (excluding high income)Europe & Central Asia (IDA & IBRD countries)European UnionFaroe IslandsFijiFinlandFragile and conflict affected situationsFranceFrench PolynesiaGabonGambia, TheGeorgiaGermanyGhanaGreeceGrenadaGuatemalaGuineaGuinea-BissauGuyanaHaitiHeavily indebted poor countries (HIPC)High incomeHondurasHong Kong SAR, ChinaHungaryIBRD onlyIcelandIDA & IBRD totalIDA blendIDA onlyIDA totalIndiaIndonesiaIran, Islamic Rep.IraqIrelandIsraelItalyJamaicaJapanJordanKazakhstanKenyaKiribatiKorea, Rep.KosovoKuwaitKyrgyz RepublicLao PDRLate-demographic dividendLatin America & Caribbean Latin America & Caribbean (excluding high income)Latin America & the Caribbean (IDA & IBRD countries)LatviaLeast developed countries: UN classificationLebanonLesothoLiberiaLibyaLithuaniaLow & middle incomeLow incomeLower middle incomeLuxembourgMacao SAR, ChinaMacedonia, FYRMadagascarMalawiMalaysiaMaldivesMaliMaltaMauritaniaMauritiusMexicoMicronesia, Fed. Sts.Middle East & North AfricaMiddle East & North Africa (excluding high income)Middle East & North Africa (IDA & IBRD countries)Middle incomeMoldovaMongoliaMontenegroMoroccoMozambiqueMyanmarNamibiaNepalNetherlandsNew CaledoniaNew ZealandNicaraguaNigerNigeriaNorth AmericaNorwayOECD membersOmanOther small statesPacific island small statesPakistanPalauPanamaPapua New GuineaParaguayPeruPhilippinesPolandPortugalPost-demographic dividendPre-demographic dividendPuerto RicoQatarRomaniaRussian FederationRwandaSamoaSaudi ArabiaSenegalSerbiaSeychellesSierra LeoneSingaporeSlovak RepublicSloveniaSmall statesSolomon IslandsSomaliaSouth AfricaSouth AsiaSouth Asia (IDA & IBRD)South SudanSpainSri LankaSt. Kitts and NevisSt. LuciaSt. Vincent and the GrenadinesSub-Saharan Africa Sub-Saharan Africa (excluding high income)Sub-Saharan Africa (IDA & IBRD countries)SudanSurinameSwazilandSwedenSwitzerlandSyrian Arab RepublicTajikistanTanzaniaThailandTimor-LesteTogoTongaTrinidad and TobagoTunisiaTurkeyTurkmenistanUgandaUkraineUnited Arab EmiratesUnited KingdomUnited StatesUpper middle incomeUruguayUzbekistanVanuatuVenezuela, RBVietnamWest Bank and GazaWorldYemen, Rep.ZambiaZimbabwe Linea del tempo:
Questa scala temporale mostra un grafico dal 1961 anno al 2016 anno. World. I dati fino ad 1960 anno non disponibili. Il numero di osservazioni attuali secondo i date: 56.
La fonte (nome):
Indicatori dello sviluppo mondiale
La fonte (organizzazione):
World Bank national accounts data, and OECD National Accounts data files.
Categorie:
Economy & Growth, Trade
sono stati aggiornati
23 apr 2017 anni
Indicatori delle variazioni dei valori per anni
Minima:
11.651
1 gen 1963 anni
Massimo:
30.802
1 gen 2009 anni
Alla data di osservazione
Valore
Variazione assoluta
La variazione rispetto al valore precedente
1 gen 1961 anni
12.008
+12.008
0.0%
1 gen 1962 anni
11.983
-0.024
-0.2%
1 gen 1963 anni
11.651
-0.332
-2.77%
1 gen 1964 anni
11.805
+0.154
1.32%
1 gen 1965 anni
11.841
+0.036
0.3%
1 gen 1966 anni
12.062
+0.222
1.87%
1 gen 1967 anni
12.304
+0.241
2.0%
1 gen 1968 anni
12.042
-0.262
-2.13%
1 gen 1969 anni
12.9
+0.859
7.13%
1 gen 1970 anni
13.228
+0.328
2.54%
1 gen 1971 anni
13.455
+0.227
1.71%
1 gen 1972 anni
13.593
+0.138
1.03%
1 gen 1973 anni
13.812
+0.219
1.61%
1 gen 1974 anni
15.444
+1.632
11.82%
1 gen 1975 anni
17.395
+1.951
12.63%
1 gen 1976 anni
16.473
-0.921
-5.3%
1 gen 1977 anni
16.9
+0.426
2.59%
1 gen 1978 anni
16.946
+0.046
0.27%
1 gen 1979 anni
16.637
-0.308
-1.82%
1 gen 1980 anni
17.701
+1.063
6.39%
1 gen 1981 anni
18.962
+1.261
7.13%
1 gen 1982 anni
19.194
+0.232
1.22%
1 gen 1983 anni
18.888
-0.305
-1.59%
1 gen 1984 anni
18.588
-0.3
-1.59%
1 gen 1985 anni
19.368
+0.78
4.19%
1 gen 1986 anni
19.066
-0.302
-1.56%
1 gen 1987 anni
17.59
-1.476
-7.74%
1 gen 1988 anni
18.294
+0.704
4.0%
1 gen 1989 anni
18.93
+0.637
3.48%
1 gen 1990 anni
19.347
+0.417
2.2%
1 gen 1991 anni
19.562
+0.214
1.11%
1 gen 1992 anni
19.466
-0.096
-0.49%
1 gen 1993 anni
20.899
+1.433
7.36%
1 gen 1994 anni
20.425
-0.474
-2.27%
1 gen 1995 anni
21.117
+0.693
3.39%
1 gen 1996 anni
22.096
+0.979
4.64%
1 gen 1997 anni
22.372
+0.276
1.25%
1 gen 1998 anni
23.316
+0.944
4.22%
1 gen 1999 anni
23.656
+0.34
1.46%
1 gen 2000 anni
24.047
+0.391
1.65%
1 gen 2001 anni
26.258
+2.211
9.19%
1 gen 2002 anni
25.561
-0.697
-2.65%
1 gen 2003 anni
25.518
-0.043
-0.17%
1 gen 2004 anni
26.068
+0.549
2.15%
1 gen 2005 anni
27.665
+1.598
6.13%
1 gen 2006 anni
28.766
+1.101
3.98%
1 gen 2007 anni
30.07
+1.304
4.53%
1 gen 2008 anni
30.254
+0.184
0.61%
1 gen 2009 anni
30.802
+0.547
1.81%
1 gen 2010 anni
26.599
-4.202
-13.64%
1 gen 2011 anni
28.896
+2.296
8.63%
1 gen 2012 anni
30.583
+1.687
5.84%
1 gen 2013 anni
30.605
+0.023
0.07%
1 gen 2014 anni
30.447
-0.158
-0.52%
1 gen 2015 anni
30.293
-0.154
-0.51%
1 gen 2016 anni
29.53
-0.763
-2.52%
Classificazione dei paesi secondo i statistiche attuali per anni


Commenti: