29
/it/
it
AIzaSyAYiBZKx7MnpbEhh9jyipgxe19OcubqV5w
April 1, 2024
134052
France
FRA
true
2
1
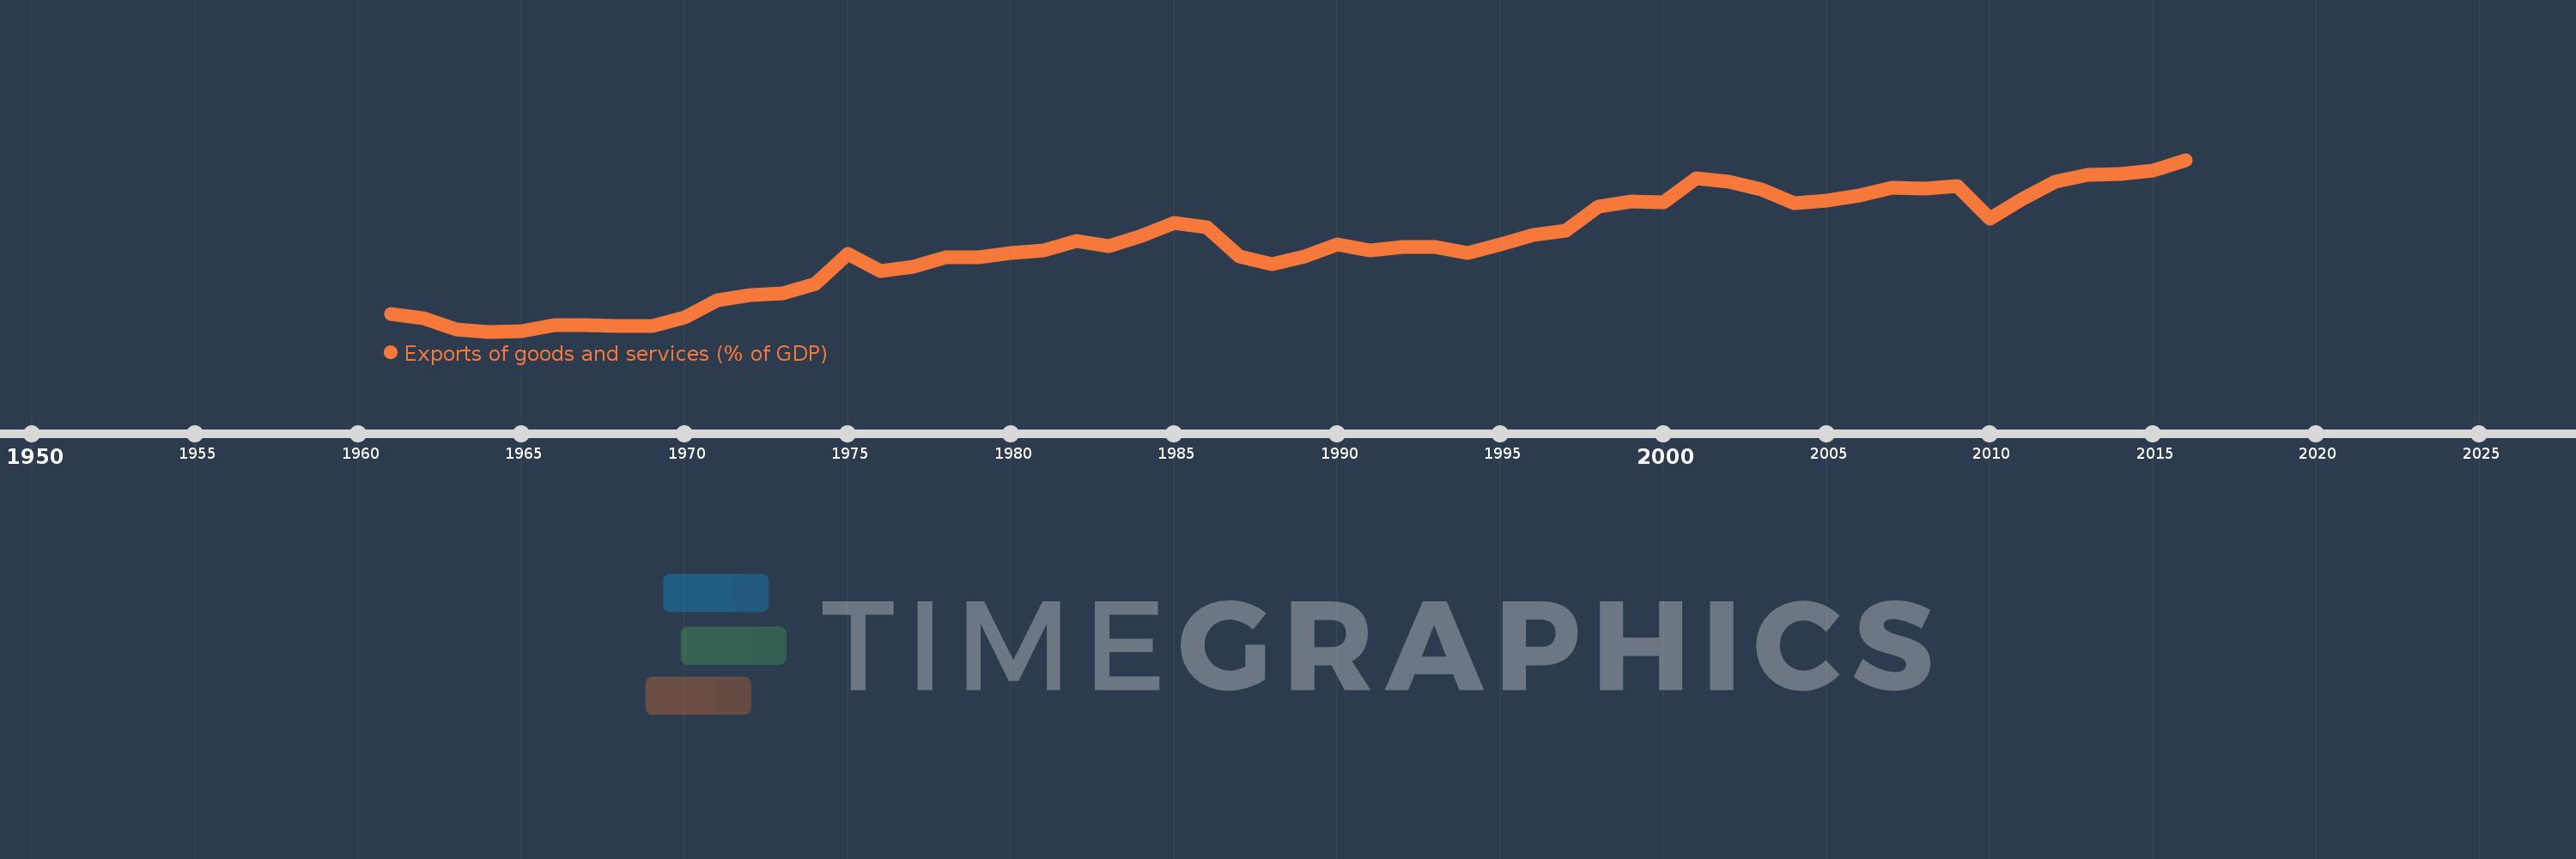
Exports of goods and services (% of GDP)
2016,2015,2014,2013,2012,2011,2010,2009,2008,2007,2006,2005,2004,2003,2002,2001,2000,1999,1998,1997,1996,1995,1994,1993,1992,1991,1990,1989,1988,1987,1986,1985,1984,1983,1982,1981,1980,1979,1978,1977,1976,1975,1974,1973,1972,1971,1970,1969,1968,1967,1966,1965,1964,1963,1962,1961
Queste statistiche in altri paesi:
AfghanistanAlbaniaAlgeriaAngolaAntigua and BarbudaArab WorldArgentinaArmeniaArubaAustraliaAustriaAzerbaijanBahamas, TheBahrainBangladeshBarbadosBelarusBelgiumBelizeBeninBermudaBhutanBoliviaBosnia and HerzegovinaBotswanaBrazilBrunei DarussalamBulgariaBurkina FasoBurundiCabo VerdeCambodiaCameroonCanadaCaribbean small statesCentral African RepublicCentral Europe and the BalticsChadChileChinaColombiaComorosCongo, Dem. Rep.Congo, Rep.Costa RicaCote d'IvoireCroatiaCubaCyprusCzech RepublicDenmarkDjiboutiDominicaDominican RepublicEarly-demographic dividendEast Asia & PacificEast Asia & Pacific (excluding high income)East Asia & Pacific (IDA & IBRD countries)EcuadorEgypt, Arab Rep.El SalvadorEquatorial GuineaEritreaEstoniaEthiopiaEuro areaEurope & Central AsiaEurope & Central Asia (excluding high income)Europe & Central Asia (IDA & IBRD countries)European UnionFaroe IslandsFijiFinlandFragile and conflict affected situationsFranceFrench PolynesiaGabonGambia, TheGeorgiaGermanyGhanaGreeceGrenadaGuatemalaGuineaGuinea-BissauGuyanaHaitiHeavily indebted poor countries (HIPC)High incomeHondurasHong Kong SAR, ChinaHungaryIBRD onlyIcelandIDA & IBRD totalIDA blendIDA onlyIDA totalIndiaIndonesiaIran, Islamic Rep.IraqIrelandIsraelItalyJamaicaJapanJordanKazakhstanKenyaKiribatiKorea, Rep.KosovoKuwaitKyrgyz RepublicLao PDRLate-demographic dividendLatin America & Caribbean Latin America & Caribbean (excluding high income)Latin America & the Caribbean (IDA & IBRD countries)LatviaLeast developed countries: UN classificationLebanonLesothoLiberiaLibyaLithuaniaLow & middle incomeLow incomeLower middle incomeLuxembourgMacao SAR, ChinaMacedonia, FYRMadagascarMalawiMalaysiaMaldivesMaliMaltaMauritaniaMauritiusMexicoMicronesia, Fed. Sts.Middle East & North AfricaMiddle East & North Africa (excluding high income)Middle East & North Africa (IDA & IBRD countries)Middle incomeMoldovaMongoliaMontenegroMoroccoMozambiqueMyanmarNamibiaNepalNetherlandsNew CaledoniaNew ZealandNicaraguaNigerNigeriaNorth AmericaNorwayOECD membersOmanOther small statesPacific island small statesPakistanPalauPanamaPapua New GuineaParaguayPeruPhilippinesPolandPortugalPost-demographic dividendPre-demographic dividendPuerto RicoQatarRomaniaRussian FederationRwandaSamoaSaudi ArabiaSenegalSerbiaSeychellesSierra LeoneSingaporeSlovak RepublicSloveniaSmall statesSolomon IslandsSomaliaSouth AfricaSouth AsiaSouth Asia (IDA & IBRD)South SudanSpainSri LankaSt. Kitts and NevisSt. LuciaSt. Vincent and the GrenadinesSub-Saharan Africa Sub-Saharan Africa (excluding high income)Sub-Saharan Africa (IDA & IBRD countries)SudanSurinameSwazilandSwedenSwitzerlandSyrian Arab RepublicTajikistanTanzaniaThailandTimor-LesteTogoTongaTrinidad and TobagoTunisiaTurkeyTurkmenistanUgandaUkraineUnited Arab EmiratesUnited KingdomUnited StatesUpper middle incomeUruguayUzbekistanVanuatuVenezuela, RBVietnamWest Bank and GazaWorldYemen, Rep.ZambiaZimbabwe Linea del tempo:
Questa scala temporale mostra un grafico dal 1961 anno al 2016 anno. France. I dati fino ad 1960 anno non disponibili. Il numero di osservazioni attuali secondo i date: 56.
La fonte (nome):
Indicatori dello sviluppo mondiale
La fonte (organizzazione):
World Bank national accounts data, and OECD National Accounts data files.
Categorie:
Economy & Growth, Trade
sono stati aggiornati
23 apr 2017 anni
Indicatori delle variazioni dei valori per anni
Minima:
12.596
1 gen 1964 anni
Massimo:
30.028
1 gen 2016 anni
Alla data di osservazione
Valore
Variazione assoluta
La variazione rispetto al valore precedente
1 gen 1961 anni
14.396
+14.396
0.0%
1 gen 1962 anni
13.919
-0.477
-3.31%
1 gen 1963 anni
12.833
-1.086
-7.8%
1 gen 1964 anni
12.596
-0.237
-1.85%
1 gen 1965 anni
12.637
+0.041
0.33%
1 gen 1966 anni
13.229
+0.592
4.69%
1 gen 1967 anni
13.288
+0.059
0.45%
1 gen 1968 anni
13.145
-0.143
-1.08%
1 gen 1969 anni
13.174
+0.029
0.22%
1 gen 1970 anni
14.012
+0.837
6.36%
1 gen 1971 anni
15.798
+1.787
12.75%
1 gen 1972 anni
16.315
+0.517
3.27%
1 gen 1973 anni
16.483
+0.168
1.03%
1 gen 1974 anni
17.395
+0.912
5.53%
1 gen 1975 anni
20.487
+3.093
17.78%
1 gen 1976 anni
18.705
-1.782
-8.7%
1 gen 1977 anni
19.21
+0.505
2.7%
1 gen 1978 anni
20.103
+0.893
4.65%
1 gen 1979 anni
20.106
+0.003
0.01%
1 gen 1980 anni
20.579
+0.473
2.35%
1 gen 1981 anni
20.845
+0.266
1.29%
1 gen 1982 anni
21.812
+0.967
4.64%
1 gen 1983 anni
21.249
-0.562
-2.58%
1 gen 1984 anni
22.274
+1.024
4.82%
1 gen 1985 anni
23.662
+1.389
6.24%
1 gen 1986 anni
23.143
-0.519
-2.19%
1 gen 1987 anni
20.217
-2.926
-12.64%
1 gen 1988 anni
19.432
-0.786
-3.89%
1 gen 1989 anni
20.196
+0.764
3.93%
1 gen 1990 anni
21.483
+1.287
6.37%
1 gen 1991 anni
20.812
-0.671
-3.12%
1 gen 1992 anni
21.168
+0.356
1.71%
1 gen 1993 anni
21.149
-0.019
-0.09%
1 gen 1994 anni
20.61
-0.539
-2.55%
1 gen 1995 anni
21.462
+0.852
4.13%
1 gen 1996 anni
22.406
+0.944
4.4%
1 gen 1997 anni
22.822
+0.417
1.86%
1 gen 1998 anni
25.243
+2.42
10.6%
1 gen 1999 anni
25.796
+0.553
2.19%
1 gen 2000 anni
25.72
-0.076
-0.29%
1 gen 2001 anni
28.173
+2.454
9.54%
1 gen 2002 anni
27.794
-0.379
-1.35%
1 gen 2003 anni
27.04
-0.754
-2.71%
1 gen 2004 anni
25.611
-1.429
-5.28%
1 gen 2005 anni
25.909
+0.298
1.16%
1 gen 2006 anni
26.369
+0.46
1.77%
1 gen 2007 anni
27.176
+0.807
3.06%
1 gen 2008 anni
27.128
-0.047
-0.17%
1 gen 2009 anni
27.386
+0.258
0.95%
1 gen 2010 anni
24.072
-3.315
-12.1%
1 gen 2011 anni
26.043
+1.972
8.19%
1 gen 2012 anni
27.803
+1.76
6.76%
1 gen 2013 anni
28.522
+0.718
2.58%
1 gen 2014 anni
28.608
+0.086
0.3%
1 gen 2015 anni
28.947
+0.339
1.19%
1 gen 2016 anni
30.028
+1.08
3.73%
Classificazione dei paesi secondo i statistiche attuali per anni


Commenti: