29
/it/
it
AIzaSyAYiBZKx7MnpbEhh9jyipgxe19OcubqV5w
April 1, 2024
214255
Norway
NOR
true
2
1
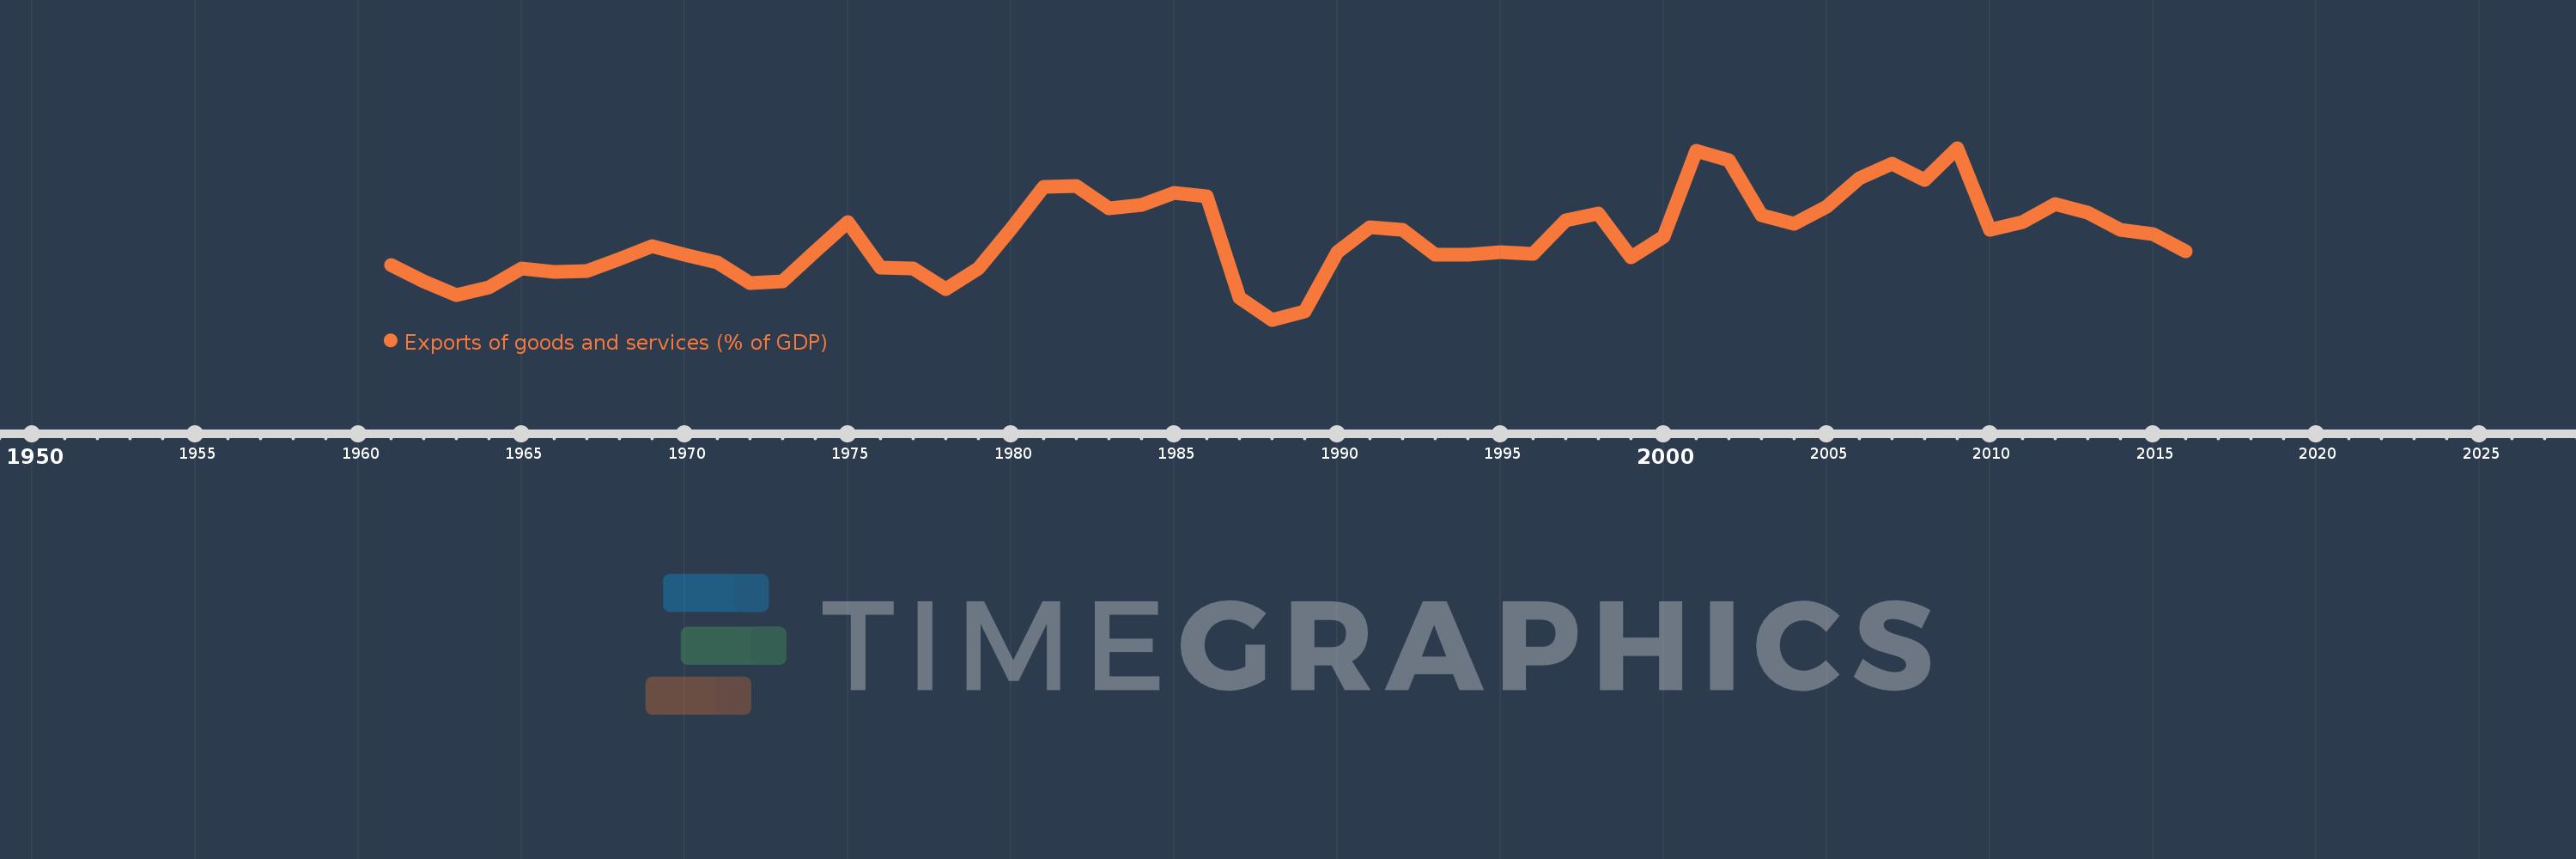
Exports of goods and services (% of GDP)
2016,2015,2014,2013,2012,2011,2010,2009,2008,2007,2006,2005,2004,2003,2002,2001,2000,1999,1998,1997,1996,1995,1994,1993,1992,1991,1990,1989,1988,1987,1986,1985,1984,1983,1982,1981,1980,1979,1978,1977,1976,1975,1974,1973,1972,1971,1970,1969,1968,1967,1966,1965,1964,1963,1962,1961
Queste statistiche in altri paesi:
AfghanistanAlbaniaAlgeriaAngolaAntigua and BarbudaArab WorldArgentinaArmeniaArubaAustraliaAustriaAzerbaijanBahamas, TheBahrainBangladeshBarbadosBelarusBelgiumBelizeBeninBermudaBhutanBoliviaBosnia and HerzegovinaBotswanaBrazilBrunei DarussalamBulgariaBurkina FasoBurundiCabo VerdeCambodiaCameroonCanadaCaribbean small statesCentral African RepublicCentral Europe and the BalticsChadChileChinaColombiaComorosCongo, Dem. Rep.Congo, Rep.Costa RicaCote d'IvoireCroatiaCubaCyprusCzech RepublicDenmarkDjiboutiDominicaDominican RepublicEarly-demographic dividendEast Asia & PacificEast Asia & Pacific (excluding high income)East Asia & Pacific (IDA & IBRD countries)EcuadorEgypt, Arab Rep.El SalvadorEquatorial GuineaEritreaEstoniaEthiopiaEuro areaEurope & Central AsiaEurope & Central Asia (excluding high income)Europe & Central Asia (IDA & IBRD countries)European UnionFaroe IslandsFijiFinlandFragile and conflict affected situationsFranceFrench PolynesiaGabonGambia, TheGeorgiaGermanyGhanaGreeceGrenadaGuatemalaGuineaGuinea-BissauGuyanaHaitiHeavily indebted poor countries (HIPC)High incomeHondurasHong Kong SAR, ChinaHungaryIBRD onlyIcelandIDA & IBRD totalIDA blendIDA onlyIDA totalIndiaIndonesiaIran, Islamic Rep.IraqIrelandIsraelItalyJamaicaJapanJordanKazakhstanKenyaKiribatiKorea, Rep.KosovoKuwaitKyrgyz RepublicLao PDRLate-demographic dividendLatin America & Caribbean Latin America & Caribbean (excluding high income)Latin America & the Caribbean (IDA & IBRD countries)LatviaLeast developed countries: UN classificationLebanonLesothoLiberiaLibyaLithuaniaLow & middle incomeLow incomeLower middle incomeLuxembourgMacao SAR, ChinaMacedonia, FYRMadagascarMalawiMalaysiaMaldivesMaliMaltaMauritaniaMauritiusMexicoMicronesia, Fed. Sts.Middle East & North AfricaMiddle East & North Africa (excluding high income)Middle East & North Africa (IDA & IBRD countries)Middle incomeMoldovaMongoliaMontenegroMoroccoMozambiqueMyanmarNamibiaNepalNetherlandsNew CaledoniaNew ZealandNicaraguaNigerNigeriaNorth AmericaNorwayOECD membersOmanOther small statesPacific island small statesPakistanPalauPanamaPapua New GuineaParaguayPeruPhilippinesPolandPortugalPost-demographic dividendPre-demographic dividendPuerto RicoQatarRomaniaRussian FederationRwandaSamoaSaudi ArabiaSenegalSerbiaSeychellesSierra LeoneSingaporeSlovak RepublicSloveniaSmall statesSolomon IslandsSomaliaSouth AfricaSouth AsiaSouth Asia (IDA & IBRD)South SudanSpainSri LankaSt. Kitts and NevisSt. LuciaSt. Vincent and the GrenadinesSub-Saharan Africa Sub-Saharan Africa (excluding high income)Sub-Saharan Africa (IDA & IBRD countries)SudanSurinameSwazilandSwedenSwitzerlandSyrian Arab RepublicTajikistanTanzaniaThailandTimor-LesteTogoTongaTrinidad and TobagoTunisiaTurkeyTurkmenistanUgandaUkraineUnited Arab EmiratesUnited KingdomUnited StatesUpper middle incomeUruguayUzbekistanVanuatuVenezuela, RBVietnamWest Bank and GazaWorldYemen, Rep.ZambiaZimbabwe Linea del tempo:
Questa scala temporale mostra un grafico dal 1961 anno al 2016 anno. Norway. I dati fino ad 1960 anno non disponibili. Il numero di osservazioni attuali secondo i date: 56.
La fonte (nome):
Indicatori dello sviluppo mondiale
La fonte (organizzazione):
World Bank national accounts data, and OECD National Accounts data files.
Categorie:
Economy & Growth, Trade
sono stati aggiornati
23 apr 2017 anni
Indicatori delle variazioni dei valori per anni
Minima:
31.762
1 gen 1988 anni
Massimo:
45.947
1 gen 2009 anni
Alla data di osservazione
Valore
Variazione assoluta
La variazione rispetto al valore precedente
1 gen 1961 anni
36.257
+36.257
0.0%
1 gen 1962 anni
34.951
-1.306
-3.6%
1 gen 1963 anni
33.772
-1.179
-3.37%
1 gen 1964 anni
34.466
+0.694
2.05%
1 gen 1965 anni
36.022
+1.555
4.51%
1 gen 1966 anni
35.719
-0.303
-0.84%
1 gen 1967 anni
35.811
+0.092
0.26%
1 gen 1968 anni
36.794
+0.983
2.74%
1 gen 1969 anni
37.861
+1.067
2.9%
1 gen 1970 anni
37.146
-0.715
-1.89%
1 gen 1971 anni
36.477
-0.669
-1.8%
1 gen 1972 anni
34.773
-1.704
-4.67%
1 gen 1973 anni
34.951
+0.179
0.51%
1 gen 1974 anni
37.408
+2.456
7.03%
1 gen 1975 anni
39.857
+2.45
6.55%
1 gen 1976 anni
36.102
-3.755
-9.42%
1 gen 1977 anni
35.971
-0.132
-0.36%
1 gen 1978 anni
34.286
-1.685
-4.68%
1 gen 1979 anni
35.983
+1.697
4.95%
1 gen 1980 anni
39.253
+3.27
9.09%
1 gen 1981 anni
42.754
+3.501
8.92%
1 gen 1982 anni
42.782
+0.027
0.06%
1 gen 1983 anni
40.956
-1.826
-4.27%
1 gen 1984 anni
41.267
+0.311
0.76%
1 gen 1985 anni
42.26
+0.993
2.41%
1 gen 1986 anni
41.98
-0.28
-0.66%
1 gen 1987 anni
33.587
-8.393
-19.99%
1 gen 1988 anni
31.762
-1.825
-5.43%
1 gen 1989 anni
32.462
+0.7
2.2%
1 gen 1990 anni
37.321
+4.859
14.97%
1 gen 1991 anni
39.419
+2.098
5.62%
1 gen 1992 anni
39.203
-0.216
-0.55%
1 gen 1993 anni
37.137
-2.066
-5.27%
1 gen 1994 anni
37.158
+0.022
0.06%
1 gen 1995 anni
37.337
+0.179
0.48%
1 gen 1996 anni
37.183
-0.154
-0.41%
1 gen 1997 anni
39.943
+2.76
7.42%
1 gen 1998 anni
40.558
+0.615
1.54%
1 gen 1999 anni
36.908
-3.65
-9.0%
1 gen 2000 anni
38.604
+1.697
4.6%
1 gen 2001 anni
45.714
+7.11
18.42%
1 gen 2002 anni
44.954
-0.76
-1.66%
1 gen 2003 anni
40.395
-4.559
-10.14%
1 gen 2004 anni
39.649
-0.746
-1.85%
1 gen 2005 anni
41.115
+1.466
3.7%
1 gen 2006 anni
43.425
+2.31
5.62%
1 gen 2007 anni
44.665
+1.239
2.85%
1 gen 2008 anni
43.304
-1.361
-3.05%
1 gen 2009 anni
45.947
+2.643
6.1%
1 gen 2010 anni
39.216
-6.731
-14.65%
1 gen 2011 anni
39.82
+0.604
1.54%
1 gen 2012 anni
41.337
+1.517
3.81%
1 gen 2013 anni
40.616
-0.721
-1.74%
1 gen 2014 anni
39.195
-1.421
-3.5%
1 gen 2015 anni
38.861
-0.335
-0.85%
1 gen 2016 anni
37.386
-1.475
-3.79%
Classificazione dei paesi secondo i statistiche attuali per anni


Commenti: