29
/it/
it
AIzaSyAYiBZKx7MnpbEhh9jyipgxe19OcubqV5w
April 1, 2024
123420
Ecuador
ECU
true
2
1
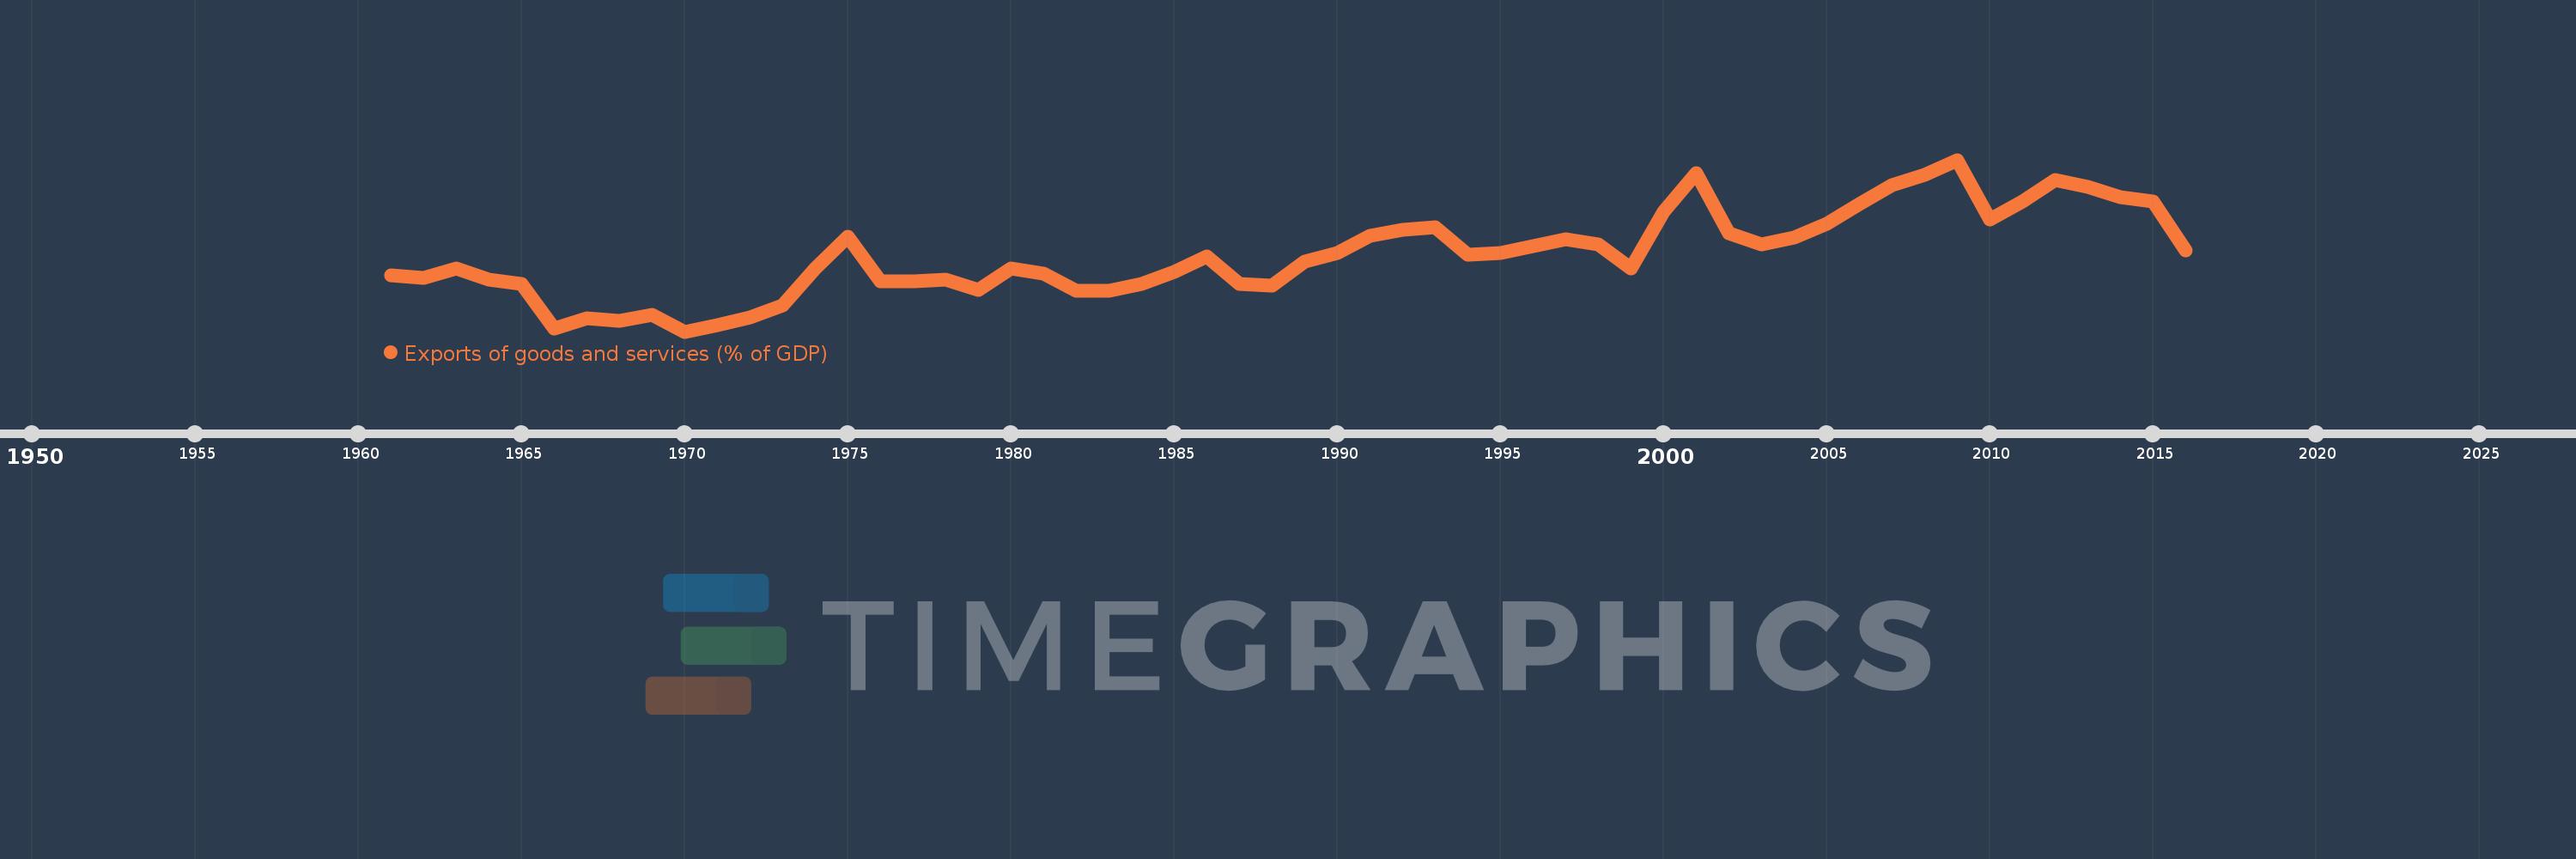
Exports of goods and services (% of GDP)
2016,2015,2014,2013,2012,2011,2010,2009,2008,2007,2006,2005,2004,2003,2002,2001,2000,1999,1998,1997,1996,1995,1994,1993,1992,1991,1990,1989,1988,1987,1986,1985,1984,1983,1982,1981,1980,1979,1978,1977,1976,1975,1974,1973,1972,1971,1970,1969,1968,1967,1966,1965,1964,1963,1962,1961
Queste statistiche in altri paesi:
AfghanistanAlbaniaAlgeriaAngolaAntigua and BarbudaArab WorldArgentinaArmeniaArubaAustraliaAustriaAzerbaijanBahamas, TheBahrainBangladeshBarbadosBelarusBelgiumBelizeBeninBermudaBhutanBoliviaBosnia and HerzegovinaBotswanaBrazilBrunei DarussalamBulgariaBurkina FasoBurundiCabo VerdeCambodiaCameroonCanadaCaribbean small statesCentral African RepublicCentral Europe and the BalticsChadChileChinaColombiaComorosCongo, Dem. Rep.Congo, Rep.Costa RicaCote d'IvoireCroatiaCubaCyprusCzech RepublicDenmarkDjiboutiDominicaDominican RepublicEarly-demographic dividendEast Asia & PacificEast Asia & Pacific (excluding high income)East Asia & Pacific (IDA & IBRD countries)EcuadorEgypt, Arab Rep.El SalvadorEquatorial GuineaEritreaEstoniaEthiopiaEuro areaEurope & Central AsiaEurope & Central Asia (excluding high income)Europe & Central Asia (IDA & IBRD countries)European UnionFaroe IslandsFijiFinlandFragile and conflict affected situationsFranceFrench PolynesiaGabonGambia, TheGeorgiaGermanyGhanaGreeceGrenadaGuatemalaGuineaGuinea-BissauGuyanaHaitiHeavily indebted poor countries (HIPC)High incomeHondurasHong Kong SAR, ChinaHungaryIBRD onlyIcelandIDA & IBRD totalIDA blendIDA onlyIDA totalIndiaIndonesiaIran, Islamic Rep.IraqIrelandIsraelItalyJamaicaJapanJordanKazakhstanKenyaKiribatiKorea, Rep.KosovoKuwaitKyrgyz RepublicLao PDRLate-demographic dividendLatin America & Caribbean Latin America & Caribbean (excluding high income)Latin America & the Caribbean (IDA & IBRD countries)LatviaLeast developed countries: UN classificationLebanonLesothoLiberiaLibyaLithuaniaLow & middle incomeLow incomeLower middle incomeLuxembourgMacao SAR, ChinaMacedonia, FYRMadagascarMalawiMalaysiaMaldivesMaliMaltaMauritaniaMauritiusMexicoMicronesia, Fed. Sts.Middle East & North AfricaMiddle East & North Africa (excluding high income)Middle East & North Africa (IDA & IBRD countries)Middle incomeMoldovaMongoliaMontenegroMoroccoMozambiqueMyanmarNamibiaNepalNetherlandsNew CaledoniaNew ZealandNicaraguaNigerNigeriaNorth AmericaNorwayOECD membersOmanOther small statesPacific island small statesPakistanPalauPanamaPapua New GuineaParaguayPeruPhilippinesPolandPortugalPost-demographic dividendPre-demographic dividendPuerto RicoQatarRomaniaRussian FederationRwandaSamoaSaudi ArabiaSenegalSerbiaSeychellesSierra LeoneSingaporeSlovak RepublicSloveniaSmall statesSolomon IslandsSomaliaSouth AfricaSouth AsiaSouth Asia (IDA & IBRD)South SudanSpainSri LankaSt. Kitts and NevisSt. LuciaSt. Vincent and the GrenadinesSub-Saharan Africa Sub-Saharan Africa (excluding high income)Sub-Saharan Africa (IDA & IBRD countries)SudanSurinameSwazilandSwedenSwitzerlandSyrian Arab RepublicTajikistanTanzaniaThailandTimor-LesteTogoTongaTrinidad and TobagoTunisiaTurkeyTurkmenistanUgandaUkraineUnited Arab EmiratesUnited KingdomUnited StatesUpper middle incomeUruguayUzbekistanVanuatuVenezuela, RBVietnamWest Bank and GazaWorldYemen, Rep.ZambiaZimbabwe Linea del tempo:
Questa scala temporale mostra un grafico dal 1961 anno al 2016 anno. Ecuador. I dati fino ad 1960 anno non disponibili. Il numero di osservazioni attuali secondo i date: 56.
La fonte (nome):
Indicatori dello sviluppo mondiale
La fonte (organizzazione):
World Bank national accounts data, and OECD National Accounts data files.
Categorie:
Economy & Growth, Trade
sono stati aggiornati
23 apr 2017 anni
Indicatori delle variazioni dei valori per anni
Minima:
8.503
1 gen 1970 anni
Massimo:
34.164
1 gen 2009 anni
Alla data di osservazione
Valore
Variazione assoluta
La variazione rispetto al valore precedente
1 gen 1961 anni
16.852
+16.852
0.0%
1 gen 1962 anni
16.493
-0.359
-2.13%
1 gen 1963 anni
17.89
+1.397
8.47%
1 gen 1964 anni
16.246
-1.644
-9.19%
1 gen 1965 anni
15.654
-0.592
-3.64%
1 gen 1966 anni
8.98
-6.675
-42.64%
1 gen 1967 anni
10.486
+1.506
16.77%
1 gen 1968 anni
10.107
-0.379
-3.61%
1 gen 1969 anni
11.042
+0.935
9.25%
1 gen 1970 anni
8.503
-2.539
-23.0%
1 gen 1971 anni
9.441
+0.938
11.03%
1 gen 1972 anni
10.58
+1.139
12.07%
1 gen 1973 anni
12.408
+1.828
17.27%
1 gen 1974 anni
17.878
+5.47
44.09%
1 gen 1975 anni
22.652
+4.774
26.7%
1 gen 1976 anni
16.071
-6.581
-29.05%
1 gen 1977 anni
16.036
-0.035
-0.22%
1 gen 1978 anni
16.303
+0.267
1.67%
1 gen 1979 anni
14.732
-1.571
-9.64%
1 gen 1980 anni
17.908
+3.176
21.56%
1 gen 1981 anni
17.148
-0.76
-4.24%
1 gen 1982 anni
14.618
-2.53
-14.75%
1 gen 1983 anni
14.656
+0.039
0.26%
1 gen 1984 anni
15.56
+0.903
6.16%
1 gen 1985 anni
17.376
+1.817
11.68%
1 gen 1986 anni
19.681
+2.305
13.26%
1 gen 1987 anni
15.629
-4.052
-20.59%
1 gen 1988 anni
15.366
-0.263
-1.68%
1 gen 1989 anni
19.006
+3.64
23.69%
1 gen 1990 anni
20.283
+1.277
6.72%
1 gen 1991 anni
22.764
+2.481
12.23%
1 gen 1992 anni
23.675
+0.91
4.0%
1 gen 1993 anni
24.134
+0.459
1.94%
1 gen 1994 anni
20.036
-4.098
-16.98%
1 gen 1995 anni
20.28
+0.244
1.22%
1 gen 1996 anni
21.287
+1.007
4.97%
1 gen 1997 anni
22.273
+0.986
4.63%
1 gen 1998 anni
21.535
-0.738
-3.31%
1 gen 1999 anni
17.892
-3.643
-16.92%
1 gen 2000 anni
26.378
+8.486
47.43%
1 gen 2001 anni
32.128
+5.75
21.8%
1 gen 2002 anni
23.223
-8.905
-27.72%
1 gen 2003 anni
21.492
-1.73
-7.45%
1 gen 2004 anni
22.598
+1.106
5.15%
1 gen 2005 anni
24.554
+1.956
8.66%
1 gen 2006 anni
27.618
+3.064
12.48%
1 gen 2007 anni
30.333
+2.715
9.83%
1 gen 2008 anni
31.932
+1.599
5.27%
1 gen 2009 anni
34.164
+2.232
6.99%
1 gen 2010 anni
25.249
-8.915
-26.09%
1 gen 2011 anni
27.895
+2.646
10.48%
1 gen 2012 anni
31.121
+3.226
11.57%
1 gen 2013 anni
30.165
-0.956
-3.07%
1 gen 2014 anni
28.638
-1.527
-5.06%
1 gen 2015 anni
27.991
-0.647
-2.26%
1 gen 2016 anni
20.674
-7.318
-26.14%
Classificazione dei paesi secondo i statistiche attuali per anni


Commenti: