29
/it/
it
AIzaSyAYiBZKx7MnpbEhh9jyipgxe19OcubqV5w
April 1, 2024
150298
Honduras
HND
true
2
1
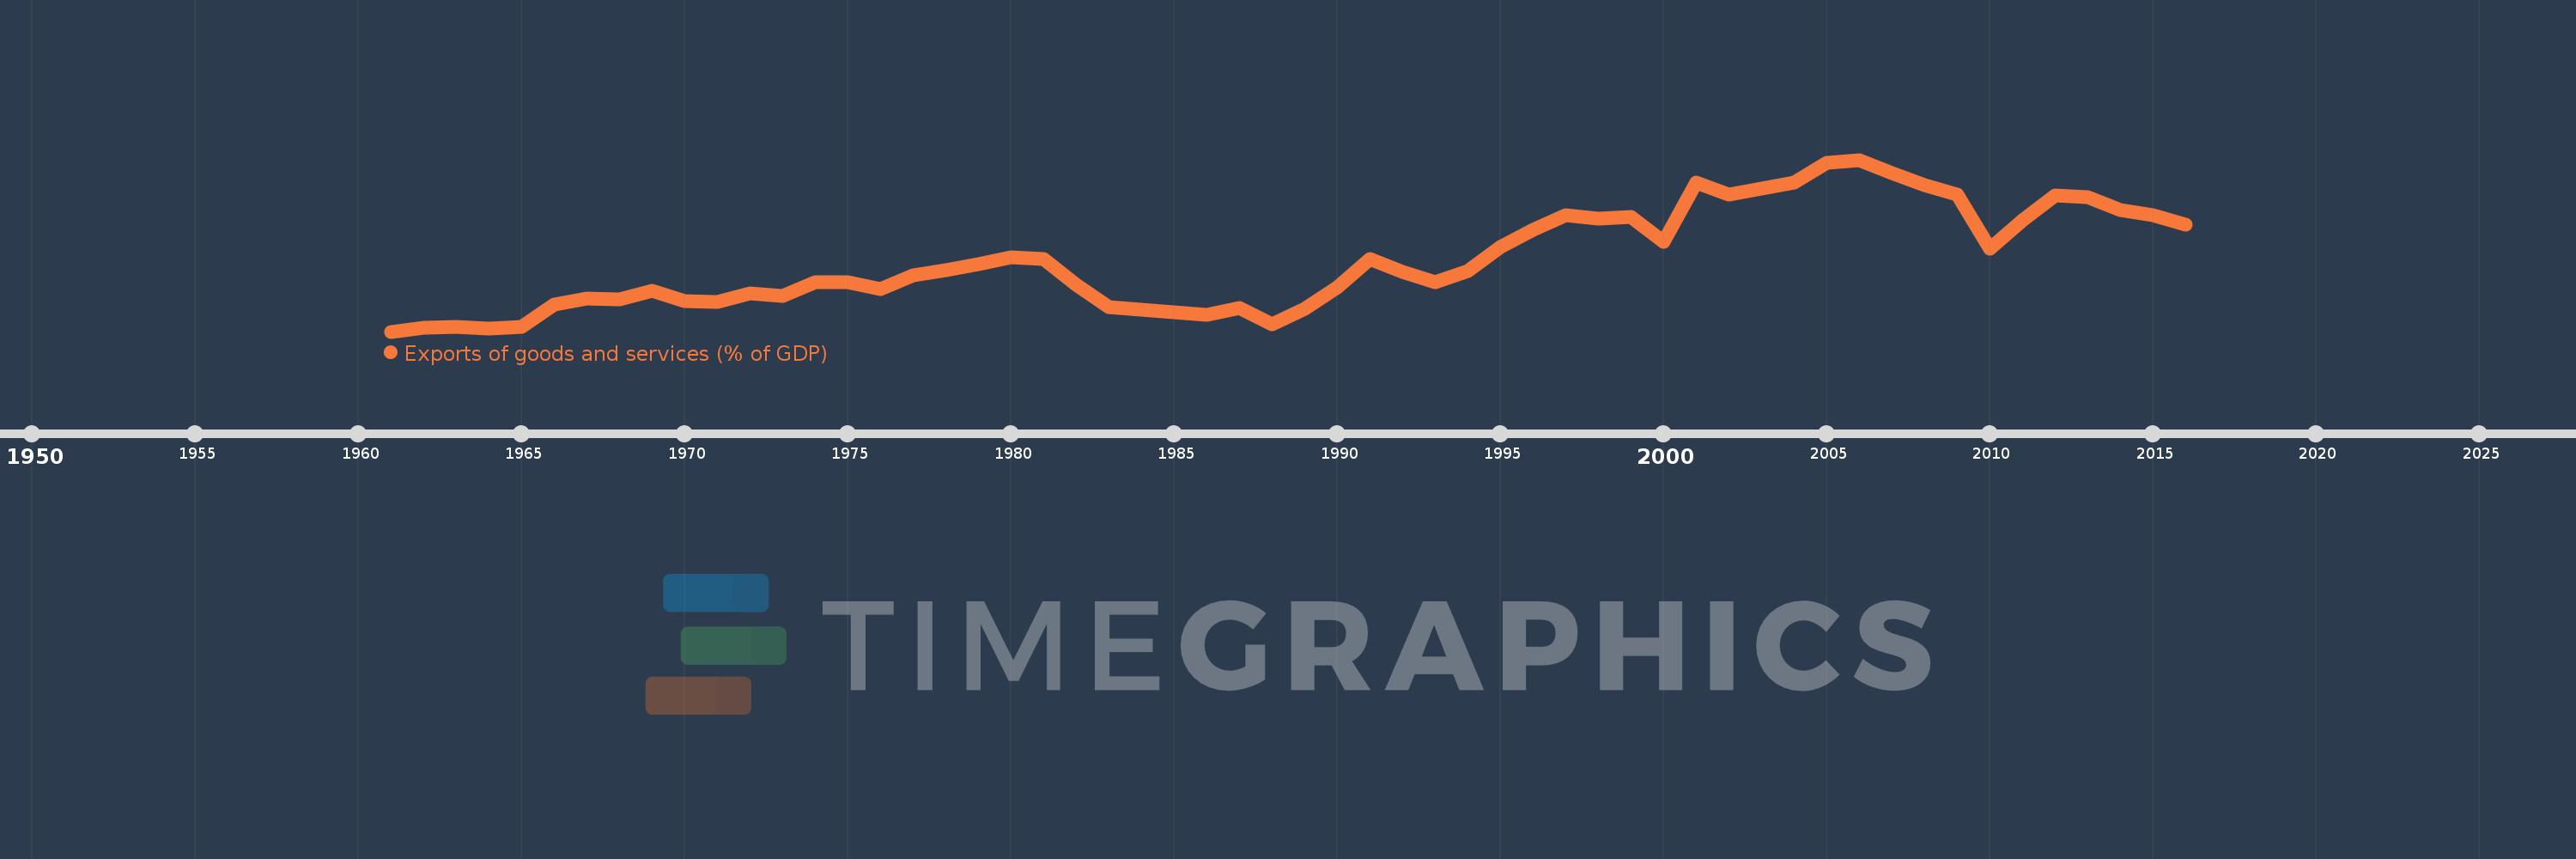
Exports of goods and services (% of GDP)
2016,2015,2014,2013,2012,2011,2010,2009,2008,2007,2006,2005,2004,2003,2002,2001,2000,1999,1998,1997,1996,1995,1994,1993,1992,1991,1990,1989,1988,1987,1986,1985,1984,1983,1982,1981,1980,1979,1978,1977,1976,1975,1974,1973,1972,1971,1970,1969,1968,1967,1966,1965,1964,1963,1962,1961
Queste statistiche in altri paesi:
AfghanistanAlbaniaAlgeriaAngolaAntigua and BarbudaArab WorldArgentinaArmeniaArubaAustraliaAustriaAzerbaijanBahamas, TheBahrainBangladeshBarbadosBelarusBelgiumBelizeBeninBermudaBhutanBoliviaBosnia and HerzegovinaBotswanaBrazilBrunei DarussalamBulgariaBurkina FasoBurundiCabo VerdeCambodiaCameroonCanadaCaribbean small statesCentral African RepublicCentral Europe and the BalticsChadChileChinaColombiaComorosCongo, Dem. Rep.Congo, Rep.Costa RicaCote d'IvoireCroatiaCubaCyprusCzech RepublicDenmarkDjiboutiDominicaDominican RepublicEarly-demographic dividendEast Asia & PacificEast Asia & Pacific (excluding high income)East Asia & Pacific (IDA & IBRD countries)EcuadorEgypt, Arab Rep.El SalvadorEquatorial GuineaEritreaEstoniaEthiopiaEuro areaEurope & Central AsiaEurope & Central Asia (excluding high income)Europe & Central Asia (IDA & IBRD countries)European UnionFaroe IslandsFijiFinlandFragile and conflict affected situationsFranceFrench PolynesiaGabonGambia, TheGeorgiaGermanyGhanaGreeceGrenadaGuatemalaGuineaGuinea-BissauGuyanaHaitiHeavily indebted poor countries (HIPC)High incomeHondurasHong Kong SAR, ChinaHungaryIBRD onlyIcelandIDA & IBRD totalIDA blendIDA onlyIDA totalIndiaIndonesiaIran, Islamic Rep.IraqIrelandIsraelItalyJamaicaJapanJordanKazakhstanKenyaKiribatiKorea, Rep.KosovoKuwaitKyrgyz RepublicLao PDRLate-demographic dividendLatin America & Caribbean Latin America & Caribbean (excluding high income)Latin America & the Caribbean (IDA & IBRD countries)LatviaLeast developed countries: UN classificationLebanonLesothoLiberiaLibyaLithuaniaLow & middle incomeLow incomeLower middle incomeLuxembourgMacao SAR, ChinaMacedonia, FYRMadagascarMalawiMalaysiaMaldivesMaliMaltaMauritaniaMauritiusMexicoMicronesia, Fed. Sts.Middle East & North AfricaMiddle East & North Africa (excluding high income)Middle East & North Africa (IDA & IBRD countries)Middle incomeMoldovaMongoliaMontenegroMoroccoMozambiqueMyanmarNamibiaNepalNetherlandsNew CaledoniaNew ZealandNicaraguaNigerNigeriaNorth AmericaNorwayOECD membersOmanOther small statesPacific island small statesPakistanPalauPanamaPapua New GuineaParaguayPeruPhilippinesPolandPortugalPost-demographic dividendPre-demographic dividendPuerto RicoQatarRomaniaRussian FederationRwandaSamoaSaudi ArabiaSenegalSerbiaSeychellesSierra LeoneSingaporeSlovak RepublicSloveniaSmall statesSolomon IslandsSomaliaSouth AfricaSouth AsiaSouth Asia (IDA & IBRD)South SudanSpainSri LankaSt. Kitts and NevisSt. LuciaSt. Vincent and the GrenadinesSub-Saharan Africa Sub-Saharan Africa (excluding high income)Sub-Saharan Africa (IDA & IBRD countries)SudanSurinameSwazilandSwedenSwitzerlandSyrian Arab RepublicTajikistanTanzaniaThailandTimor-LesteTogoTongaTrinidad and TobagoTunisiaTurkeyTurkmenistanUgandaUkraineUnited Arab EmiratesUnited KingdomUnited StatesUpper middle incomeUruguayUzbekistanVanuatuVenezuela, RBVietnamWest Bank and GazaWorldYemen, Rep.ZambiaZimbabwe Linea del tempo:
Questa scala temporale mostra un grafico dal 1961 anno al 2016 anno. Honduras. I dati fino ad 1960 anno non disponibili. Il numero di osservazioni attuali secondo i date: 56.
La fonte (nome):
Indicatori dello sviluppo mondiale
La fonte (organizzazione):
World Bank national accounts data, and OECD National Accounts data files.
Categorie:
Economy & Growth, Trade
sono stati aggiornati
23 apr 2017 anni
Indicatori delle variazioni dei valori per anni
Minima:
21.391
1 gen 1961 anni
Massimo:
59.006
1 gen 2006 anni
Alla data di osservazione
Valore
Variazione assoluta
La variazione rispetto al valore precedente
1 gen 1961 anni
21.391
+21.391
0.0%
1 gen 1962 anni
22.319
+0.928
4.34%
1 gen 1963 anni
22.489
+0.17
0.76%
1 gen 1964 anni
22.087
-0.402
-1.79%
1 gen 1965 anni
22.473
+0.386
1.75%
1 gen 1966 anni
27.268
+4.796
21.34%
1 gen 1967 anni
28.621
+1.353
4.96%
1 gen 1968 anni
28.524
-0.097
-0.34%
1 gen 1969 anni
30.411
+1.888
6.62%
1 gen 1970 anni
27.979
-2.432
-8.0%
1 gen 1971 anni
27.911
-0.068
-0.24%
1 gen 1972 anni
29.685
+1.774
6.36%
1 gen 1973 anni
29.265
-0.42
-1.42%
1 gen 1974 anni
32.219
+2.954
10.09%
1 gen 1975 anni
32.141
-0.078
-0.24%
1 gen 1976 anni
30.694
-1.447
-4.5%
1 gen 1977 anni
33.717
+3.023
9.85%
1 gen 1978 anni
34.831
+1.114
3.3%
1 gen 1979 anni
36.175
+1.344
3.86%
1 gen 1980 anni
37.686
+1.511
4.18%
1 gen 1981 anni
37.237
-0.449
-1.19%
1 gen 1982 anni
31.637
-5.6
-15.04%
1 gen 1983 anni
26.675
-4.962
-15.68%
1 gen 1984 anni
26.162
-0.513
-1.92%
1 gen 1985 anni
25.701
-0.461
-1.76%
1 gen 1986 anni
25.1
-0.601
-2.34%
1 gen 1987 anni
26.585
+1.486
5.92%
1 gen 1988 anni
22.962
-3.623
-13.63%
1 gen 1989 anni
26.289
+3.327
14.49%
1 gen 1990 anni
31.004
+4.715
17.94%
1 gen 1991 anni
37.202
+6.197
19.99%
1 gen 1992 anni
34.522
-2.679
-7.2%
1 gen 1993 anni
32.17
-2.352
-6.81%
1 gen 1994 anni
34.682
+2.512
7.81%
1 gen 1995 anni
39.838
+5.156
14.87%
1 gen 1996 anni
43.699
+3.861
9.69%
1 gen 1997 anni
46.852
+3.154
7.22%
1 gen 1998 anni
46.186
-0.666
-1.42%
1 gen 1999 anni
46.422
+0.236
0.51%
1 gen 2000 anni
41.023
-5.4
-11.63%
1 gen 2001 anni
53.972
+12.949
31.57%
1 gen 2002 anni
51.382
-2.59
-4.8%
1 gen 2003 anni
52.731
+1.349
2.63%
1 gen 2004 anni
54.094
+1.363
2.59%
1 gen 2005 anni
58.423
+4.329
8.0%
1 gen 2006 anni
59.006
+0.583
1.0%
1 gen 2007 anni
56.055
-2.951
-5.0%
1 gen 2008 anni
53.509
-2.546
-4.54%
1 gen 2009 anni
51.325
-2.184
-4.08%
1 gen 2010 anni
39.53
-11.795
-22.98%
1 gen 2011 anni
45.759
+6.229
15.76%
1 gen 2012 anni
51.258
+5.499
12.02%
1 gen 2013 anni
50.903
-0.355
-0.69%
1 gen 2014 anni
47.941
-2.961
-5.82%
1 gen 2015 anni
46.869
-1.072
-2.24%
1 gen 2016 anni
44.846
-2.023
-4.32%
Classificazione dei paesi secondo i statistiche attuali per anni


Commenti: