29
/it/
it
AIzaSyAYiBZKx7MnpbEhh9jyipgxe19OcubqV5w
April 1, 2024
207883
Netherlands
NLD
true
2
1
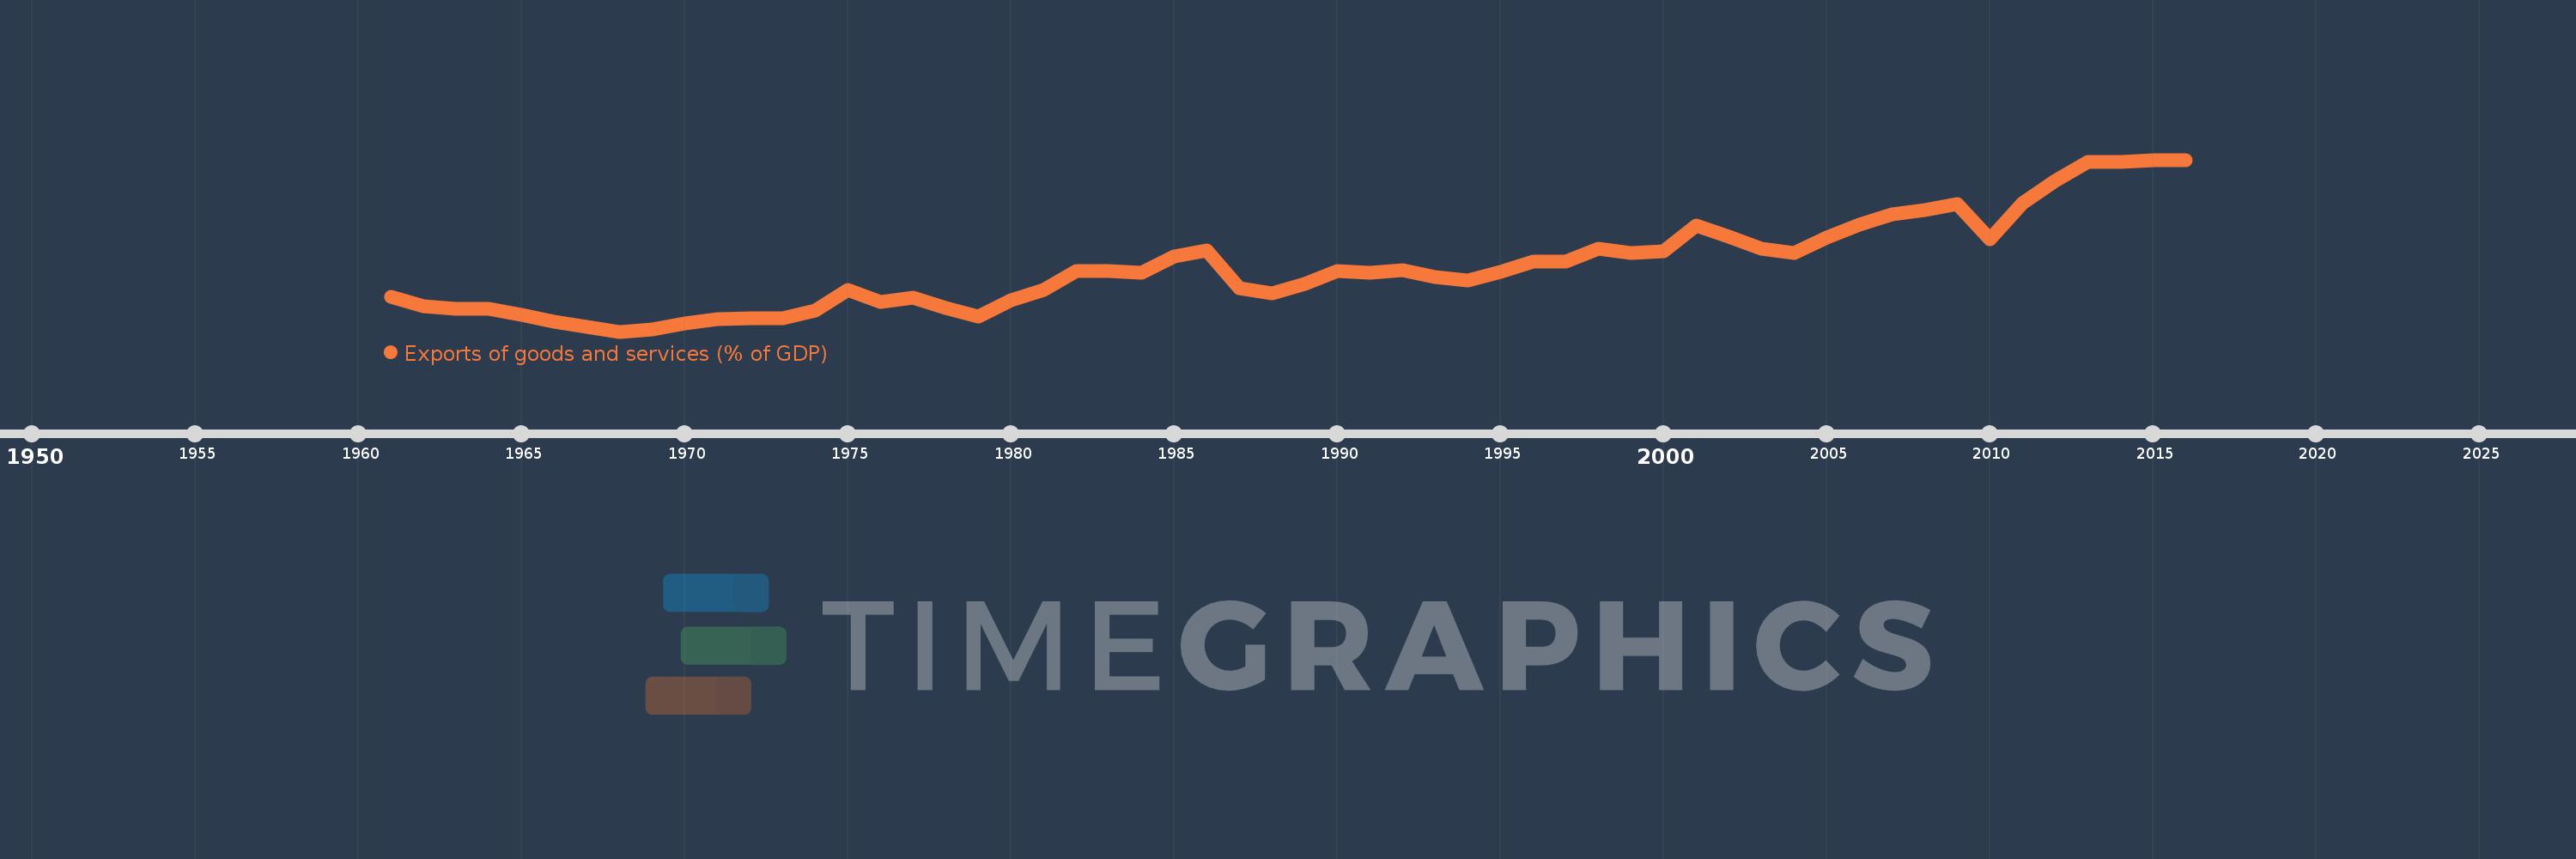
Exports of goods and services (% of GDP)
2016,2015,2014,2013,2012,2011,2010,2009,2008,2007,2006,2005,2004,2003,2002,2001,2000,1999,1998,1997,1996,1995,1994,1993,1992,1991,1990,1989,1988,1987,1986,1985,1984,1983,1982,1981,1980,1979,1978,1977,1976,1975,1974,1973,1972,1971,1970,1969,1968,1967,1966,1965,1964,1963,1962,1961
Queste statistiche in altri paesi:
AfghanistanAlbaniaAlgeriaAngolaAntigua and BarbudaArab WorldArgentinaArmeniaArubaAustraliaAustriaAzerbaijanBahamas, TheBahrainBangladeshBarbadosBelarusBelgiumBelizeBeninBermudaBhutanBoliviaBosnia and HerzegovinaBotswanaBrazilBrunei DarussalamBulgariaBurkina FasoBurundiCabo VerdeCambodiaCameroonCanadaCaribbean small statesCentral African RepublicCentral Europe and the BalticsChadChileChinaColombiaComorosCongo, Dem. Rep.Congo, Rep.Costa RicaCote d'IvoireCroatiaCubaCyprusCzech RepublicDenmarkDjiboutiDominicaDominican RepublicEarly-demographic dividendEast Asia & PacificEast Asia & Pacific (excluding high income)East Asia & Pacific (IDA & IBRD countries)EcuadorEgypt, Arab Rep.El SalvadorEquatorial GuineaEritreaEstoniaEthiopiaEuro areaEurope & Central AsiaEurope & Central Asia (excluding high income)Europe & Central Asia (IDA & IBRD countries)European UnionFaroe IslandsFijiFinlandFragile and conflict affected situationsFranceFrench PolynesiaGabonGambia, TheGeorgiaGermanyGhanaGreeceGrenadaGuatemalaGuineaGuinea-BissauGuyanaHaitiHeavily indebted poor countries (HIPC)High incomeHondurasHong Kong SAR, ChinaHungaryIBRD onlyIcelandIDA & IBRD totalIDA blendIDA onlyIDA totalIndiaIndonesiaIran, Islamic Rep.IraqIrelandIsraelItalyJamaicaJapanJordanKazakhstanKenyaKiribatiKorea, Rep.KosovoKuwaitKyrgyz RepublicLao PDRLate-demographic dividendLatin America & Caribbean Latin America & Caribbean (excluding high income)Latin America & the Caribbean (IDA & IBRD countries)LatviaLeast developed countries: UN classificationLebanonLesothoLiberiaLibyaLithuaniaLow & middle incomeLow incomeLower middle incomeLuxembourgMacao SAR, ChinaMacedonia, FYRMadagascarMalawiMalaysiaMaldivesMaliMaltaMauritaniaMauritiusMexicoMicronesia, Fed. Sts.Middle East & North AfricaMiddle East & North Africa (excluding high income)Middle East & North Africa (IDA & IBRD countries)Middle incomeMoldovaMongoliaMontenegroMoroccoMozambiqueMyanmarNamibiaNepalNetherlandsNew CaledoniaNew ZealandNicaraguaNigerNigeriaNorth AmericaNorwayOECD membersOmanOther small statesPacific island small statesPakistanPalauPanamaPapua New GuineaParaguayPeruPhilippinesPolandPortugalPost-demographic dividendPre-demographic dividendPuerto RicoQatarRomaniaRussian FederationRwandaSamoaSaudi ArabiaSenegalSerbiaSeychellesSierra LeoneSingaporeSlovak RepublicSloveniaSmall statesSolomon IslandsSomaliaSouth AfricaSouth AsiaSouth Asia (IDA & IBRD)South SudanSpainSri LankaSt. Kitts and NevisSt. LuciaSt. Vincent and the GrenadinesSub-Saharan Africa Sub-Saharan Africa (excluding high income)Sub-Saharan Africa (IDA & IBRD countries)SudanSurinameSwazilandSwedenSwitzerlandSyrian Arab RepublicTajikistanTanzaniaThailandTimor-LesteTogoTongaTrinidad and TobagoTunisiaTurkeyTurkmenistanUgandaUkraineUnited Arab EmiratesUnited KingdomUnited StatesUpper middle incomeUruguayUzbekistanVanuatuVenezuela, RBVietnamWest Bank and GazaWorldYemen, Rep.ZambiaZimbabwe Linea del tempo:
Questa scala temporale mostra un grafico dal 1961 anno al 2016 anno. Netherlands. I dati fino ad 1960 anno non disponibili. Il numero di osservazioni attuali secondo i date: 56.
La fonte (nome):
Indicatori dello sviluppo mondiale
La fonte (organizzazione):
World Bank national accounts data, and OECD National Accounts data files.
Categorie:
Economy & Growth, Trade
sono stati aggiornati
23 apr 2017 anni
Indicatori delle variazioni dei valori per anni
Minima:
40.468
1 gen 1968 anni
Massimo:
82.565
1 gen 2015 anni
Alla data di osservazione
Valore
Variazione assoluta
La variazione rispetto al valore precedente
1 gen 1961 anni
48.894
+48.894
0.0%
1 gen 1962 anni
46.607
-2.287
-4.68%
1 gen 1963 anni
45.943
-0.665
-1.43%
1 gen 1964 anni
46.033
+0.09
0.2%
1 gen 1965 anni
44.611
-1.422
-3.09%
1 gen 1966 anni
42.811
-1.8
-4.04%
1 gen 1967 anni
41.651
-1.159
-2.71%
1 gen 1968 anni
40.468
-1.184
-2.84%
1 gen 1969 anni
40.938
+0.47
1.16%
1 gen 1970 anni
42.457
+1.519
3.71%
1 gen 1971 anni
43.436
+0.98
2.31%
1 gen 1972 anni
43.702
+0.266
0.61%
1 gen 1973 anni
43.659
-0.043
-0.1%
1 gen 1974 anni
45.724
+2.065
4.73%
1 gen 1975 anni
50.725
+5.001
10.94%
1 gen 1976 anni
47.813
-2.912
-5.74%
1 gen 1977 anni
48.887
+1.074
2.25%
1 gen 1978 anni
46.258
-2.63
-5.38%
1 gen 1979 anni
44.164
-2.094
-4.53%
1 gen 1980 anni
48.187
+4.023
9.11%
1 gen 1981 anni
50.764
+2.577
5.35%
1 gen 1982 anni
55.268
+4.503
8.87%
1 gen 1983 anni
55.278
+0.011
0.02%
1 gen 1984 anni
54.964
-0.314
-0.57%
1 gen 1985 anni
58.796
+3.832
6.97%
1 gen 1986 anni
60.313
+1.517
2.58%
1 gen 1987 anni
51.132
-9.181
-15.22%
1 gen 1988 anni
49.788
-1.344
-2.63%
1 gen 1989 anni
52.09
+2.302
4.62%
1 gen 1990 anni
55.407
+3.317
6.37%
1 gen 1991 anni
54.786
-0.621
-1.12%
1 gen 1992 anni
55.485
+0.699
1.28%
1 gen 1993 anni
53.74
-1.745
-3.14%
1 gen 1994 anni
52.971
-0.769
-1.43%
1 gen 1995 anni
55.109
+2.138
4.04%
1 gen 1996 anni
57.611
+2.502
4.54%
1 gen 1997 anni
57.646
+0.035
0.06%
1 gen 1998 anni
60.682
+3.036
5.27%
1 gen 1999 anni
59.734
-0.947
-1.56%
1 gen 2000 anni
60.24
+0.506
0.85%
1 gen 2001 anni
66.493
+6.253
10.38%
1 gen 2002 anni
63.823
-2.669
-4.01%
1 gen 2003 anni
60.751
-3.073
-4.81%
1 gen 2004 anni
59.709
-1.041
-1.71%
1 gen 2005 anni
63.536
+3.826
6.41%
1 gen 2006 anni
66.617
+3.081
4.85%
1 gen 2007 anni
69.279
+2.662
4.0%
1 gen 2008 anni
70.274
+0.995
1.44%
1 gen 2009 anni
71.643
+1.369
1.95%
1 gen 2010 anni
63.154
-8.488
-11.85%
1 gen 2011 anni
71.954
+8.8
13.93%
1 gen 2012 anni
77.356
+5.402
7.51%
1 gen 2013 anni
81.936
+4.58
5.92%
1 gen 2014 anni
82.01
+0.074
0.09%
1 gen 2015 anni
82.565
+0.555
0.68%
1 gen 2016 anni
82.463
-0.102
-0.12%
Classificazione dei paesi secondo i statistiche attuali per anni


Commenti: