29
/it/
it
AIzaSyAYiBZKx7MnpbEhh9jyipgxe19OcubqV5w
April 1, 2024
131924
Fiji
FJI
true
2
1
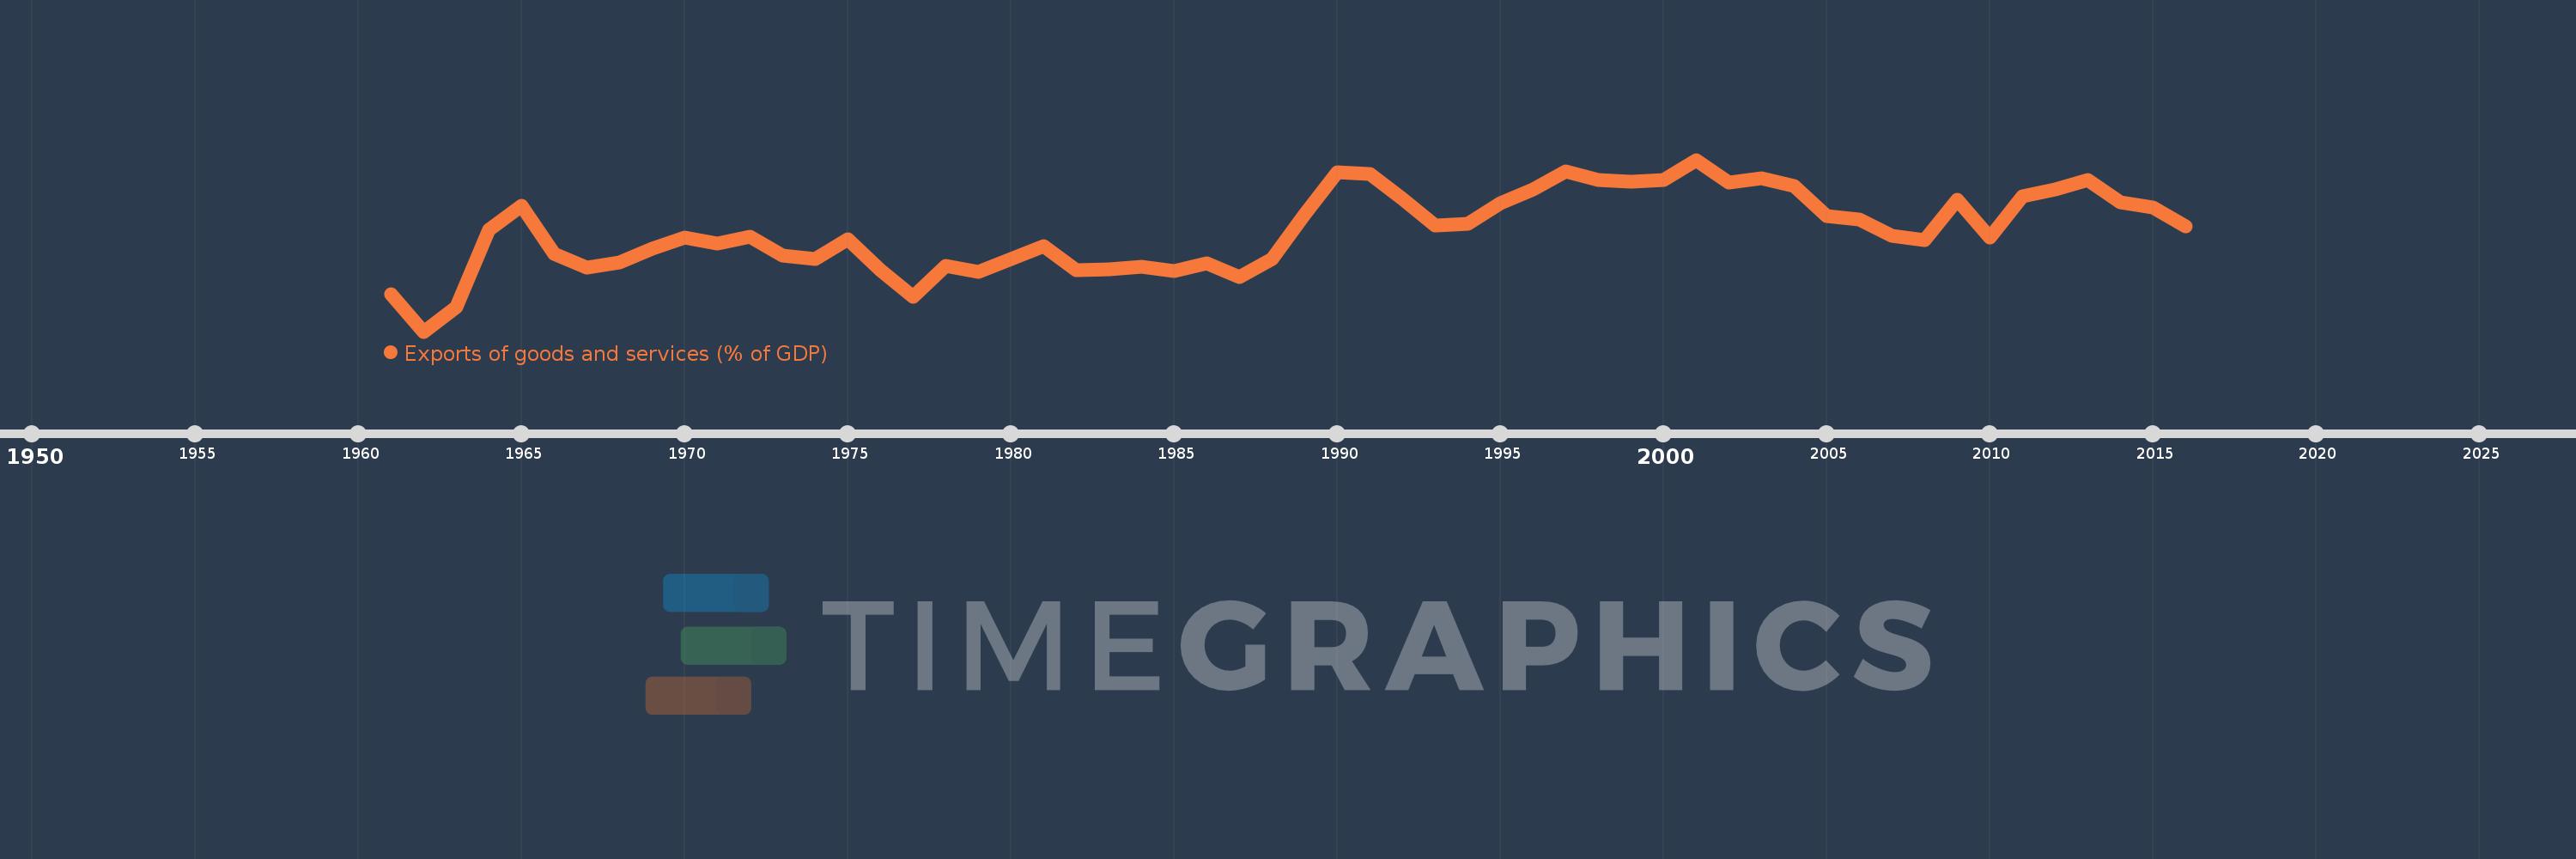
Exports of goods and services (% of GDP)
2016,2015,2014,2013,2012,2011,2010,2009,2008,2007,2006,2005,2004,2003,2002,2001,2000,1999,1998,1997,1996,1995,1994,1993,1992,1991,1990,1989,1988,1987,1986,1985,1984,1983,1982,1981,1980,1979,1978,1977,1976,1975,1974,1973,1972,1971,1970,1969,1968,1967,1966,1965,1964,1963,1962,1961
Queste statistiche in altri paesi:
AfghanistanAlbaniaAlgeriaAngolaAntigua and BarbudaArab WorldArgentinaArmeniaArubaAustraliaAustriaAzerbaijanBahamas, TheBahrainBangladeshBarbadosBelarusBelgiumBelizeBeninBermudaBhutanBoliviaBosnia and HerzegovinaBotswanaBrazilBrunei DarussalamBulgariaBurkina FasoBurundiCabo VerdeCambodiaCameroonCanadaCaribbean small statesCentral African RepublicCentral Europe and the BalticsChadChileChinaColombiaComorosCongo, Dem. Rep.Congo, Rep.Costa RicaCote d'IvoireCroatiaCubaCyprusCzech RepublicDenmarkDjiboutiDominicaDominican RepublicEarly-demographic dividendEast Asia & PacificEast Asia & Pacific (excluding high income)East Asia & Pacific (IDA & IBRD countries)EcuadorEgypt, Arab Rep.El SalvadorEquatorial GuineaEritreaEstoniaEthiopiaEuro areaEurope & Central AsiaEurope & Central Asia (excluding high income)Europe & Central Asia (IDA & IBRD countries)European UnionFaroe IslandsFijiFinlandFragile and conflict affected situationsFranceFrench PolynesiaGabonGambia, TheGeorgiaGermanyGhanaGreeceGrenadaGuatemalaGuineaGuinea-BissauGuyanaHaitiHeavily indebted poor countries (HIPC)High incomeHondurasHong Kong SAR, ChinaHungaryIBRD onlyIcelandIDA & IBRD totalIDA blendIDA onlyIDA totalIndiaIndonesiaIran, Islamic Rep.IraqIrelandIsraelItalyJamaicaJapanJordanKazakhstanKenyaKiribatiKorea, Rep.KosovoKuwaitKyrgyz RepublicLao PDRLate-demographic dividendLatin America & Caribbean Latin America & Caribbean (excluding high income)Latin America & the Caribbean (IDA & IBRD countries)LatviaLeast developed countries: UN classificationLebanonLesothoLiberiaLibyaLithuaniaLow & middle incomeLow incomeLower middle incomeLuxembourgMacao SAR, ChinaMacedonia, FYRMadagascarMalawiMalaysiaMaldivesMaliMaltaMauritaniaMauritiusMexicoMicronesia, Fed. Sts.Middle East & North AfricaMiddle East & North Africa (excluding high income)Middle East & North Africa (IDA & IBRD countries)Middle incomeMoldovaMongoliaMontenegroMoroccoMozambiqueMyanmarNamibiaNepalNetherlandsNew CaledoniaNew ZealandNicaraguaNigerNigeriaNorth AmericaNorwayOECD membersOmanOther small statesPacific island small statesPakistanPalauPanamaPapua New GuineaParaguayPeruPhilippinesPolandPortugalPost-demographic dividendPre-demographic dividendPuerto RicoQatarRomaniaRussian FederationRwandaSamoaSaudi ArabiaSenegalSerbiaSeychellesSierra LeoneSingaporeSlovak RepublicSloveniaSmall statesSolomon IslandsSomaliaSouth AfricaSouth AsiaSouth Asia (IDA & IBRD)South SudanSpainSri LankaSt. Kitts and NevisSt. LuciaSt. Vincent and the GrenadinesSub-Saharan Africa Sub-Saharan Africa (excluding high income)Sub-Saharan Africa (IDA & IBRD countries)SudanSurinameSwazilandSwedenSwitzerlandSyrian Arab RepublicTajikistanTanzaniaThailandTimor-LesteTogoTongaTrinidad and TobagoTunisiaTurkeyTurkmenistanUgandaUkraineUnited Arab EmiratesUnited KingdomUnited StatesUpper middle incomeUruguayUzbekistanVanuatuVenezuela, RBVietnamWest Bank and GazaWorldYemen, Rep.ZambiaZimbabwe Linea del tempo:
Questa scala temporale mostra un grafico dal 1961 anno al 2016 anno. Fiji. I dati fino ad 1960 anno non disponibili. Il numero di osservazioni attuali secondo i date: 56.
La fonte (nome):
Indicatori dello sviluppo mondiale
La fonte (organizzazione):
World Bank national accounts data, and OECD National Accounts data files.
Categorie:
Economy & Growth, Trade
sono stati aggiornati
23 apr 2017 anni
Indicatori delle variazioni dei valori per anni
Minima:
30.678
1 gen 1962 anni
Massimo:
65.159
1 gen 2001 anni
Alla data di osservazione
Valore
Variazione assoluta
La variazione rispetto al valore precedente
1 gen 1961 anni
38.117
+38.117
0.0%
1 gen 1962 anni
30.678
-7.438
-19.51%
1 gen 1963 anni
35.656
+4.978
16.23%
1 gen 1964 anni
51.07
+15.414
43.23%
1 gen 1965 anni
55.935
+4.865
9.53%
1 gen 1966 anni
46.318
-9.617
-17.19%
1 gen 1967 anni
43.442
-2.877
-6.21%
1 gen 1968 anni
44.572
+1.13
2.6%
1 gen 1969 anni
47.394
+2.822
6.33%
1 gen 1970 anni
49.529
+2.136
4.51%
1 gen 1971 anni
48.384
-1.145
-2.31%
1 gen 1972 anni
49.788
+1.404
2.9%
1 gen 1973 anni
45.886
-3.902
-7.84%
1 gen 1974 anni
45.285
-0.601
-1.31%
1 gen 1975 anni
49.133
+3.848
8.5%
1 gen 1976 anni
42.994
-6.139
-12.49%
1 gen 1977 anni
37.707
-5.288
-12.3%
1 gen 1978 anni
43.918
+6.211
16.47%
1 gen 1979 anni
42.652
-1.266
-2.88%
1 gen 1980 anni
45.271
+2.619
6.14%
1 gen 1981 anni
47.779
+2.508
5.54%
1 gen 1982 anni
43.022
-4.757
-9.96%
1 gen 1983 anni
43.232
+0.21
0.49%
1 gen 1984 anni
43.609
+0.377
0.87%
1 gen 1985 anni
42.829
-0.78
-1.79%
1 gen 1986 anni
44.36
+1.531
3.57%
1 gen 1987 anni
41.664
-2.696
-6.08%
1 gen 1988 anni
45.318
+3.654
8.77%
1 gen 1989 anni
54.296
+8.978
19.81%
1 gen 1990 anni
62.67
+8.374
15.42%
1 gen 1991 anni
62.343
-0.326
-0.52%
1 gen 1992 anni
57.311
-5.032
-8.07%
1 gen 1993 anni
51.918
-5.394
-9.41%
1 gen 1994 anni
52.378
+0.46
0.89%
1 gen 1995 anni
56.421
+4.044
7.72%
1 gen 1996 anni
59.291
+2.87
5.09%
1 gen 1997 anni
62.848
+3.557
6.0%
1 gen 1998 anni
61.04
-1.808
-2.88%
1 gen 1999 anni
60.804
-0.236
-0.39%
1 gen 2000 anni
61.023
+0.218
0.36%
1 gen 2001 anni
65.159
+4.136
6.78%
1 gen 2002 anni
60.674
-4.485
-6.88%
1 gen 2003 anni
61.485
+0.811
1.34%
1 gen 2004 anni
59.867
-1.618
-2.63%
1 gen 2005 anni
53.815
-6.052
-10.11%
1 gen 2006 anni
53.13
-0.684
-1.27%
1 gen 2007 anni
49.905
-3.225
-6.07%
1 gen 2008 anni
49.04
-0.866
-1.73%
1 gen 2009 anni
57.141
+8.101
16.52%
1 gen 2010 anni
49.507
-7.633
-13.36%
1 gen 2011 anni
57.838
+8.33
16.83%
1 gen 2012 anni
59.281
+1.443
2.49%
1 gen 2013 anni
61.111
+1.831
3.09%
1 gen 2014 anni
56.669
-4.442
-7.27%
1 gen 2015 anni
55.589
-1.08
-1.91%
1 gen 2016 anni
51.809
-3.78
-6.8%
Classificazione dei paesi secondo i statistiche attuali per anni


Commenti: