29
/it/
it
AIzaSyAYiBZKx7MnpbEhh9jyipgxe19OcubqV5w
April 1, 2024
127295
Equatorial Guinea
GNQ
true
2
1
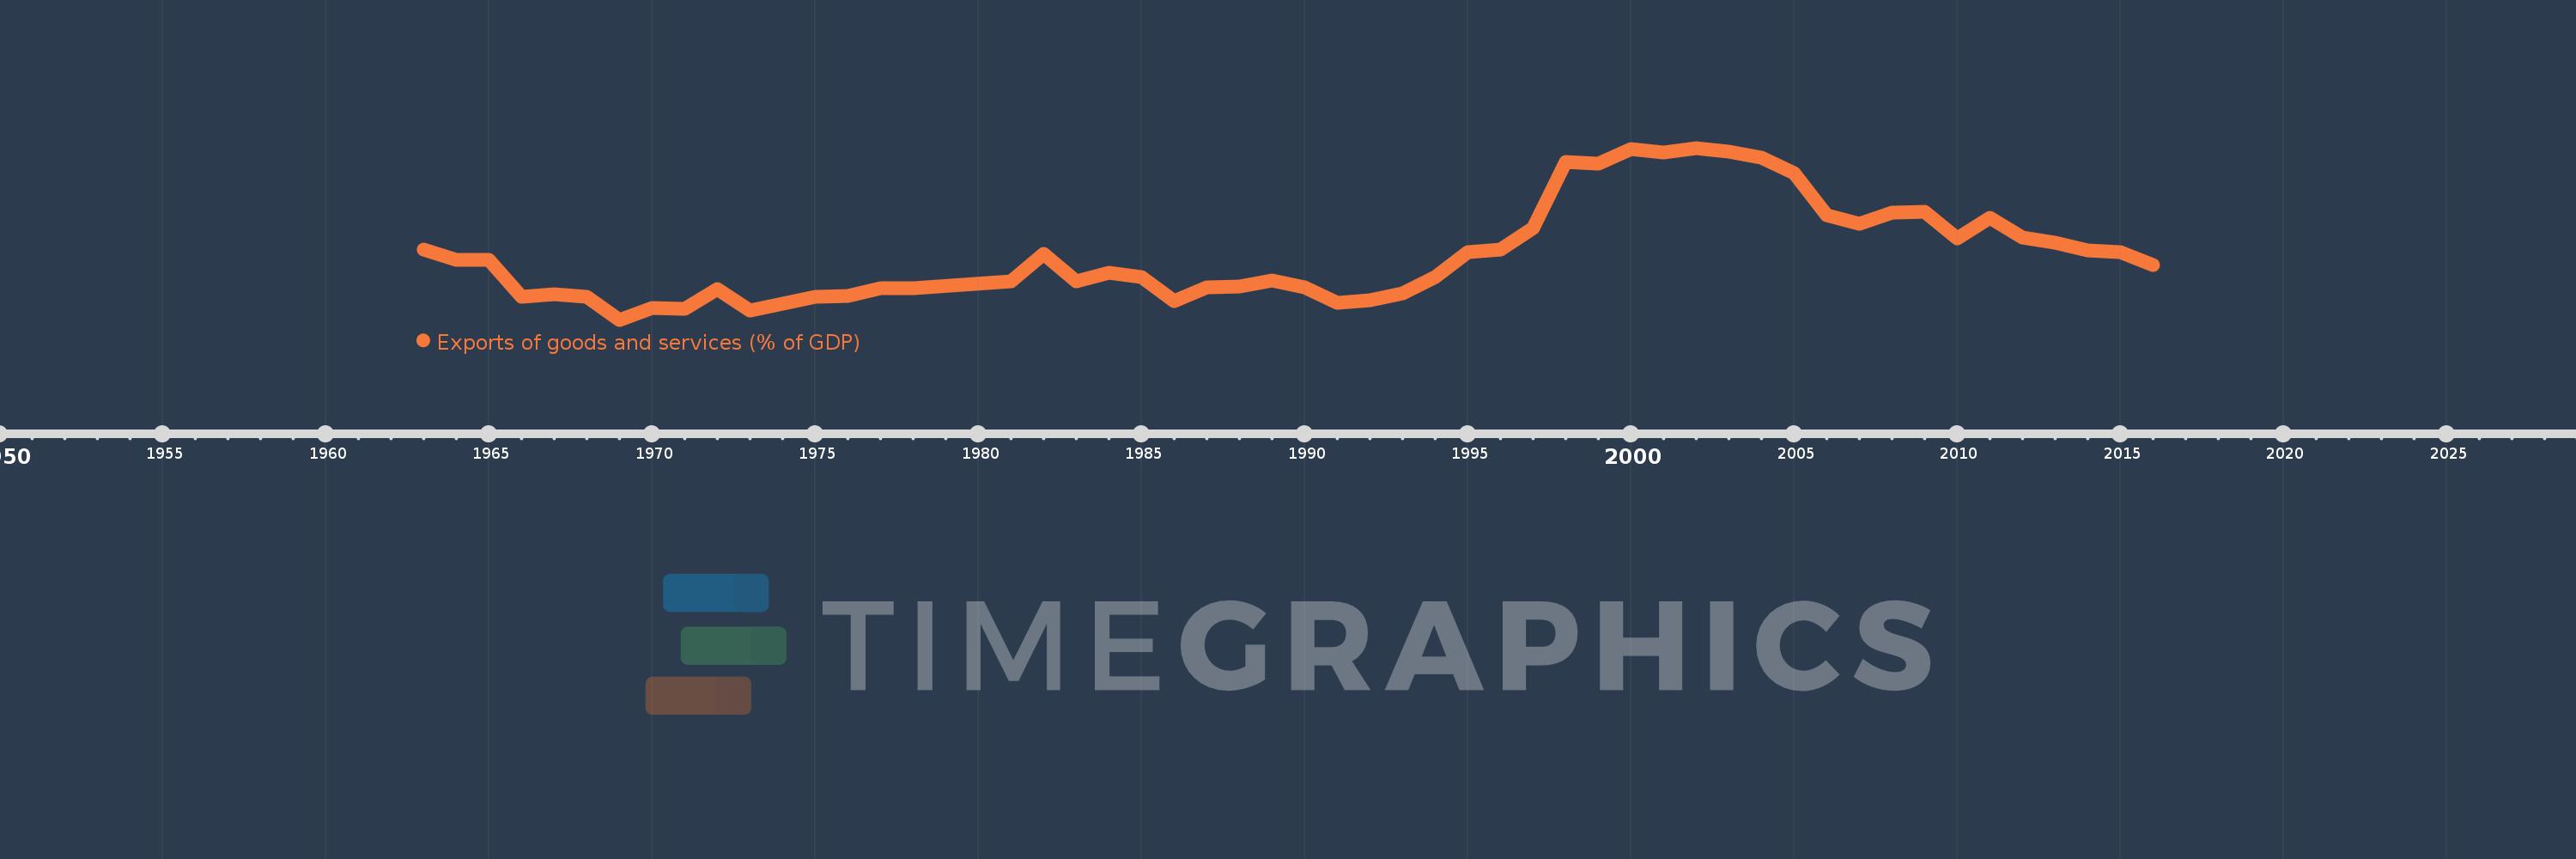
Exports of goods and services (% of GDP)
2016,2015,2014,2013,2012,2011,2010,2009,2008,2007,2006,2005,2004,2003,2002,2001,2000,1999,1998,1997,1996,1995,1994,1993,1992,1991,1990,1989,1988,1987,1986,1985,1984,1983,1982,1981,1978,1977,1976,1975,1974,1973,1972,1971,1970,1969,1968,1967,1966,1965,1964,1963
Queste statistiche in altri paesi:
AfghanistanAlbaniaAlgeriaAngolaAntigua and BarbudaArab WorldArgentinaArmeniaArubaAustraliaAustriaAzerbaijanBahamas, TheBahrainBangladeshBarbadosBelarusBelgiumBelizeBeninBermudaBhutanBoliviaBosnia and HerzegovinaBotswanaBrazilBrunei DarussalamBulgariaBurkina FasoBurundiCabo VerdeCambodiaCameroonCanadaCaribbean small statesCentral African RepublicCentral Europe and the BalticsChadChileChinaColombiaComorosCongo, Dem. Rep.Congo, Rep.Costa RicaCote d'IvoireCroatiaCubaCyprusCzech RepublicDenmarkDjiboutiDominicaDominican RepublicEarly-demographic dividendEast Asia & PacificEast Asia & Pacific (excluding high income)East Asia & Pacific (IDA & IBRD countries)EcuadorEgypt, Arab Rep.El SalvadorEquatorial GuineaEritreaEstoniaEthiopiaEuro areaEurope & Central AsiaEurope & Central Asia (excluding high income)Europe & Central Asia (IDA & IBRD countries)European UnionFaroe IslandsFijiFinlandFragile and conflict affected situationsFranceFrench PolynesiaGabonGambia, TheGeorgiaGermanyGhanaGreeceGrenadaGuatemalaGuineaGuinea-BissauGuyanaHaitiHeavily indebted poor countries (HIPC)High incomeHondurasHong Kong SAR, ChinaHungaryIBRD onlyIcelandIDA & IBRD totalIDA blendIDA onlyIDA totalIndiaIndonesiaIran, Islamic Rep.IraqIrelandIsraelItalyJamaicaJapanJordanKazakhstanKenyaKiribatiKorea, Rep.KosovoKuwaitKyrgyz RepublicLao PDRLate-demographic dividendLatin America & Caribbean Latin America & Caribbean (excluding high income)Latin America & the Caribbean (IDA & IBRD countries)LatviaLeast developed countries: UN classificationLebanonLesothoLiberiaLibyaLithuaniaLow & middle incomeLow incomeLower middle incomeLuxembourgMacao SAR, ChinaMacedonia, FYRMadagascarMalawiMalaysiaMaldivesMaliMaltaMauritaniaMauritiusMexicoMicronesia, Fed. Sts.Middle East & North AfricaMiddle East & North Africa (excluding high income)Middle East & North Africa (IDA & IBRD countries)Middle incomeMoldovaMongoliaMontenegroMoroccoMozambiqueMyanmarNamibiaNepalNetherlandsNew CaledoniaNew ZealandNicaraguaNigerNigeriaNorth AmericaNorwayOECD membersOmanOther small statesPacific island small statesPakistanPalauPanamaPapua New GuineaParaguayPeruPhilippinesPolandPortugalPost-demographic dividendPre-demographic dividendPuerto RicoQatarRomaniaRussian FederationRwandaSamoaSaudi ArabiaSenegalSerbiaSeychellesSierra LeoneSingaporeSlovak RepublicSloveniaSmall statesSolomon IslandsSomaliaSouth AfricaSouth AsiaSouth Asia (IDA & IBRD)South SudanSpainSri LankaSt. Kitts and NevisSt. LuciaSt. Vincent and the GrenadinesSub-Saharan Africa Sub-Saharan Africa (excluding high income)Sub-Saharan Africa (IDA & IBRD countries)SudanSurinameSwazilandSwedenSwitzerlandSyrian Arab RepublicTajikistanTanzaniaThailandTimor-LesteTogoTongaTrinidad and TobagoTunisiaTurkeyTurkmenistanUgandaUkraineUnited Arab EmiratesUnited KingdomUnited StatesUpper middle incomeUruguayUzbekistanVanuatuVenezuela, RBVietnamWest Bank and GazaWorldYemen, Rep.ZambiaZimbabwe Linea del tempo:
Questa scala temporale mostra un grafico dal 1963 anno al 2016 anno. Equatorial Guinea. I dati fino ad 1962 anno non disponibili. Il numero di osservazioni attuali secondo i date: 52.
La fonte (nome):
Indicatori dello sviluppo mondiale
La fonte (organizzazione):
World Bank national accounts data, and OECD National Accounts data files.
Categorie:
Economy & Growth, Trade
sono stati aggiornati
23 apr 2017 anni
Indicatori delle variazioni dei valori per anni
Minima:
29.623
1 gen 1969 anni
Massimo:
124.393
1 gen 2002 anni
Alla data di osservazione
Valore
Variazione assoluta
La variazione rispetto al valore precedente
1 gen 1963 anni
68.137
+68.137
0.0%
1 gen 1964 anni
62.801
-5.336
-7.83%
1 gen 1965 anni
62.602
-0.199
-0.32%
1 gen 1966 anni
42.112
-20.491
-32.73%
1 gen 1967 anni
43.819
+1.707
4.05%
1 gen 1968 anni
42.425
-1.394
-3.18%
1 gen 1969 anni
29.623
-12.802
-30.18%
1 gen 1970 anni
36.104
+6.481
21.88%
1 gen 1971 anni
35.7
-0.405
-1.12%
1 gen 1972 anni
46.467
+10.768
30.16%
1 gen 1973 anni
34.79
-11.677
-25.13%
1 gen 1974 anni
38.339
+3.549
10.2%
1 gen 1975 anni
42.34
+4.0
10.43%
1 gen 1976 anni
42.981
+0.641
1.51%
1 gen 1977 anni
47.001
+4.02
9.35%
1 gen 1978 anni
47.012
+0.01
0.02%
1 gen 1981 anni
50.658
+3.646
7.76%
1 gen 1982 anni
65.999
+15.342
30.28%
1 gen 1983 anni
50.695
-15.305
-23.19%
1 gen 1984 anni
55.419
+4.724
9.32%
1 gen 1985 anni
53.288
-2.131
-3.85%
1 gen 1986 anni
39.827
-13.46
-25.26%
1 gen 1987 anni
47.387
+7.56
18.98%
1 gen 1988 anni
47.865
+0.478
1.01%
1 gen 1989 anni
51.47
+3.605
7.53%
1 gen 1990 anni
47.333
-4.137
-8.04%
1 gen 1991 anni
38.99
-8.343
-17.63%
1 gen 1992 anni
40.224
+1.234
3.17%
1 gen 1993 anni
44.234
+4.01
9.97%
1 gen 1994 anni
53.188
+8.954
20.24%
1 gen 1995 anni
66.971
+13.783
25.91%
1 gen 1996 anni
68.526
+1.555
2.32%
1 gen 1997 anni
80.066
+11.54
16.84%
1 gen 1998 anni
116.704
+36.637
45.76%
1 gen 1999 anni
115.947
-0.756
-0.65%
1 gen 2000 anni
123.643
+7.695
6.64%
1 gen 2001 anni
122.063
-1.579
-1.28%
1 gen 2002 anni
124.393
+2.33
1.91%
1 gen 2003 anni
122.263
-2.13
-1.71%
1 gen 2004 anni
118.864
-3.399
-2.78%
1 gen 2005 anni
110.618
-8.246
-6.94%
1 gen 2006 anni
87.417
-23.201
-20.97%
1 gen 2007 anni
82.326
-5.092
-5.82%
1 gen 2008 anni
88.621
+6.296
7.65%
1 gen 2009 anni
89.224
+0.603
0.68%
1 gen 2010 anni
74.342
-14.882
-16.68%
1 gen 2011 anni
85.758
+11.416
15.36%
1 gen 2012 anni
75.095
-10.663
-12.43%
1 gen 2013 anni
71.905
-3.19
-4.25%
1 gen 2014 anni
67.653
-4.252
-5.91%
1 gen 2015 anni
66.807
-0.846
-1.25%
1 gen 2016 anni
59.692
-7.115
-10.65%
Classificazione dei paesi secondo i statistiche attuali per anni


Commenti: