29
/it/
it
AIzaSyAYiBZKx7MnpbEhh9jyipgxe19OcubqV5w
April 1, 2024
133088
Finland
FIN
true
2
1
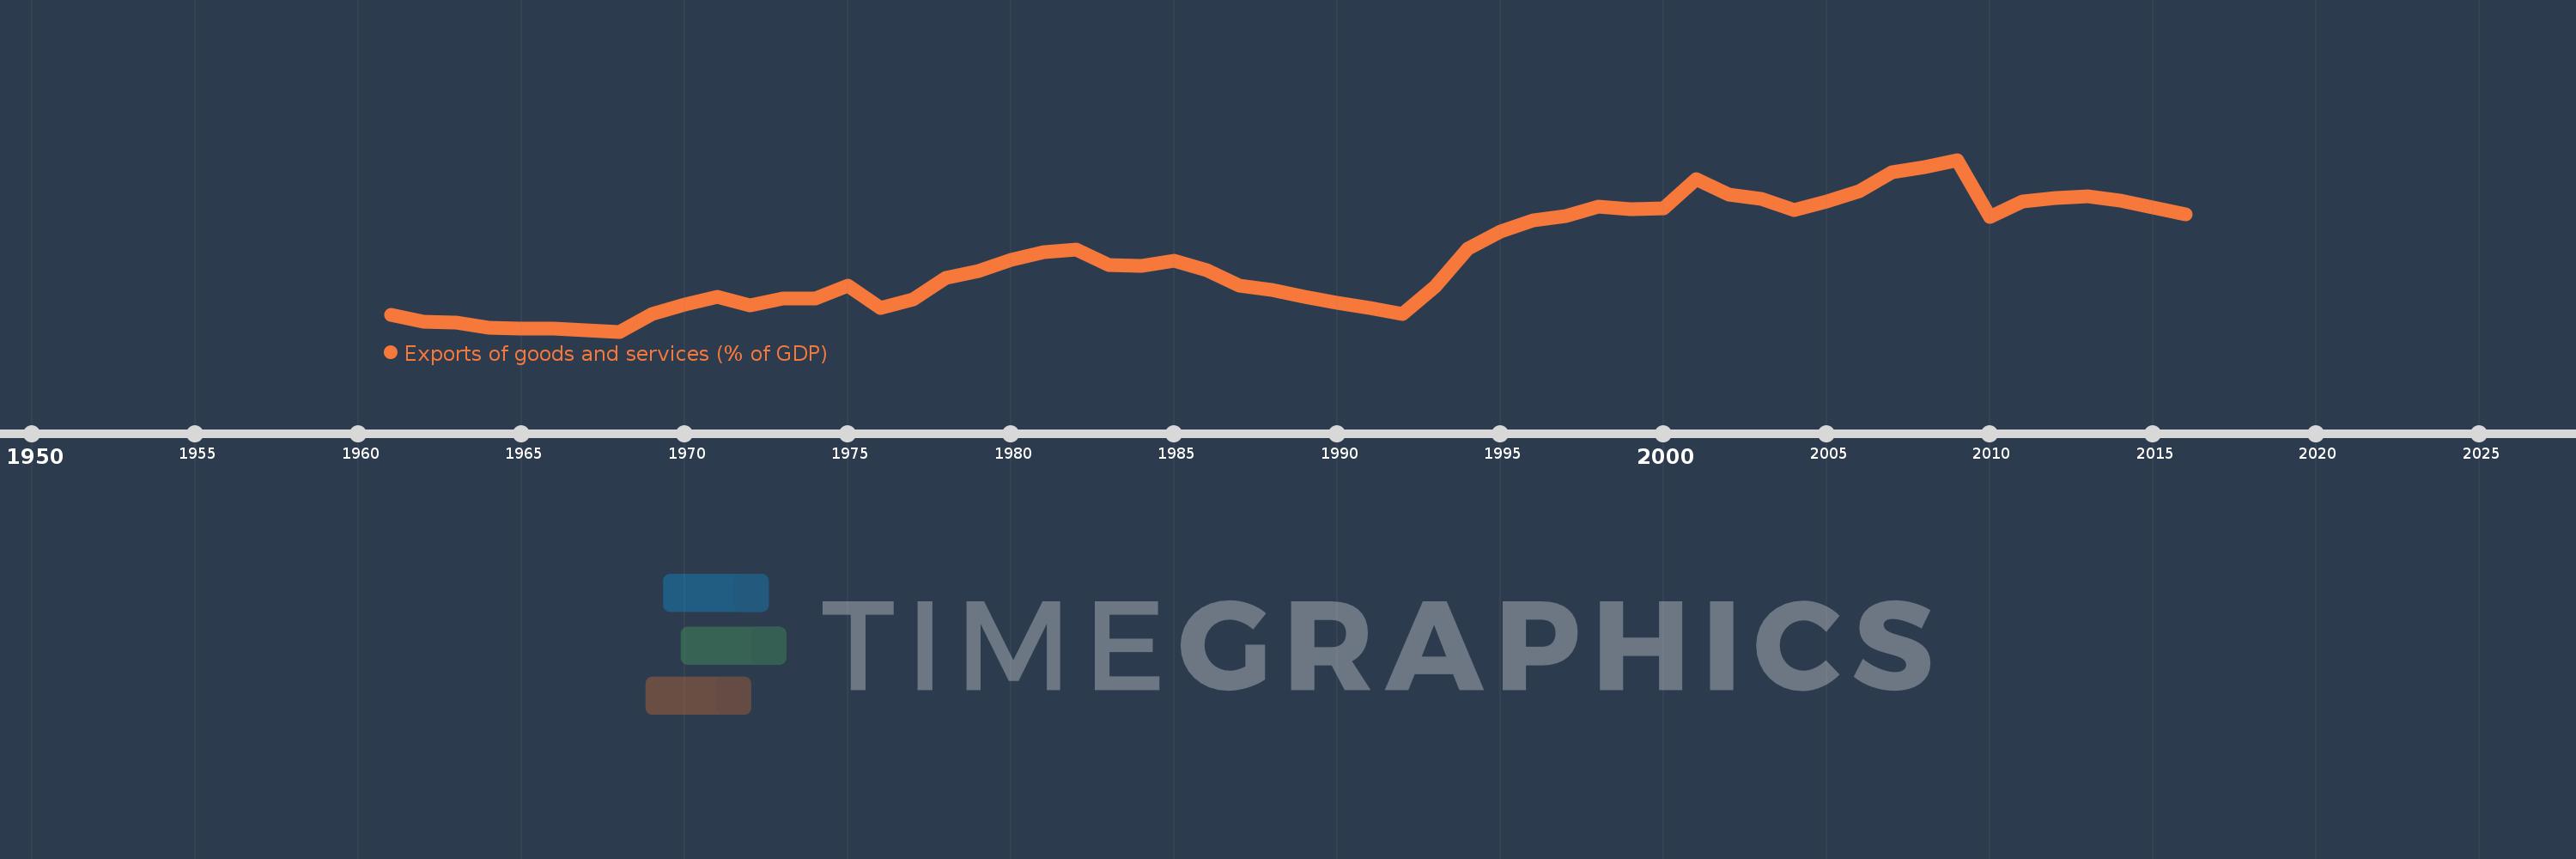
Exports of goods and services (% of GDP)
2016,2015,2014,2013,2012,2011,2010,2009,2008,2007,2006,2005,2004,2003,2002,2001,2000,1999,1998,1997,1996,1995,1994,1993,1992,1991,1990,1989,1988,1987,1986,1985,1984,1983,1982,1981,1980,1979,1978,1977,1976,1975,1974,1973,1972,1971,1970,1969,1968,1967,1966,1965,1964,1963,1962,1961
Queste statistiche in altri paesi:
AfghanistanAlbaniaAlgeriaAngolaAntigua and BarbudaArab WorldArgentinaArmeniaArubaAustraliaAustriaAzerbaijanBahamas, TheBahrainBangladeshBarbadosBelarusBelgiumBelizeBeninBermudaBhutanBoliviaBosnia and HerzegovinaBotswanaBrazilBrunei DarussalamBulgariaBurkina FasoBurundiCabo VerdeCambodiaCameroonCanadaCaribbean small statesCentral African RepublicCentral Europe and the BalticsChadChileChinaColombiaComorosCongo, Dem. Rep.Congo, Rep.Costa RicaCote d'IvoireCroatiaCubaCyprusCzech RepublicDenmarkDjiboutiDominicaDominican RepublicEarly-demographic dividendEast Asia & PacificEast Asia & Pacific (excluding high income)East Asia & Pacific (IDA & IBRD countries)EcuadorEgypt, Arab Rep.El SalvadorEquatorial GuineaEritreaEstoniaEthiopiaEuro areaEurope & Central AsiaEurope & Central Asia (excluding high income)Europe & Central Asia (IDA & IBRD countries)European UnionFaroe IslandsFijiFinlandFragile and conflict affected situationsFranceFrench PolynesiaGabonGambia, TheGeorgiaGermanyGhanaGreeceGrenadaGuatemalaGuineaGuinea-BissauGuyanaHaitiHeavily indebted poor countries (HIPC)High incomeHondurasHong Kong SAR, ChinaHungaryIBRD onlyIcelandIDA & IBRD totalIDA blendIDA onlyIDA totalIndiaIndonesiaIran, Islamic Rep.IraqIrelandIsraelItalyJamaicaJapanJordanKazakhstanKenyaKiribatiKorea, Rep.KosovoKuwaitKyrgyz RepublicLao PDRLate-demographic dividendLatin America & Caribbean Latin America & Caribbean (excluding high income)Latin America & the Caribbean (IDA & IBRD countries)LatviaLeast developed countries: UN classificationLebanonLesothoLiberiaLibyaLithuaniaLow & middle incomeLow incomeLower middle incomeLuxembourgMacao SAR, ChinaMacedonia, FYRMadagascarMalawiMalaysiaMaldivesMaliMaltaMauritaniaMauritiusMexicoMicronesia, Fed. Sts.Middle East & North AfricaMiddle East & North Africa (excluding high income)Middle East & North Africa (IDA & IBRD countries)Middle incomeMoldovaMongoliaMontenegroMoroccoMozambiqueMyanmarNamibiaNepalNetherlandsNew CaledoniaNew ZealandNicaraguaNigerNigeriaNorth AmericaNorwayOECD membersOmanOther small statesPacific island small statesPakistanPalauPanamaPapua New GuineaParaguayPeruPhilippinesPolandPortugalPost-demographic dividendPre-demographic dividendPuerto RicoQatarRomaniaRussian FederationRwandaSamoaSaudi ArabiaSenegalSerbiaSeychellesSierra LeoneSingaporeSlovak RepublicSloveniaSmall statesSolomon IslandsSomaliaSouth AfricaSouth AsiaSouth Asia (IDA & IBRD)South SudanSpainSri LankaSt. Kitts and NevisSt. LuciaSt. Vincent and the GrenadinesSub-Saharan Africa Sub-Saharan Africa (excluding high income)Sub-Saharan Africa (IDA & IBRD countries)SudanSurinameSwazilandSwedenSwitzerlandSyrian Arab RepublicTajikistanTanzaniaThailandTimor-LesteTogoTongaTrinidad and TobagoTunisiaTurkeyTurkmenistanUgandaUkraineUnited Arab EmiratesUnited KingdomUnited StatesUpper middle incomeUruguayUzbekistanVanuatuVenezuela, RBVietnamWest Bank and GazaWorldYemen, Rep.ZambiaZimbabwe Linea del tempo:
Questa scala temporale mostra un grafico dal 1961 anno al 2016 anno. Finland. I dati fino ad 1960 anno non disponibili. Il numero di osservazioni attuali secondo i date: 56.
La fonte (nome):
Indicatori dello sviluppo mondiale
La fonte (organizzazione):
World Bank national accounts data, and OECD National Accounts data files.
Categorie:
Economy & Growth, Trade
sono stati aggiornati
23 apr 2017 anni
Indicatori delle variazioni dei valori per anni
Minima:
18.524
1 gen 1968 anni
Massimo:
45.078
1 gen 2009 anni
Alla data di osservazione
Valore
Variazione assoluta
La variazione rispetto al valore precedente
1 gen 1961 anni
21.11
+21.11
0.0%
1 gen 1962 anni
20.01
-1.1
-5.21%
1 gen 1963 anni
19.92
-0.089
-0.45%
1 gen 1964 anni
19.073
-0.847
-4.25%
1 gen 1965 anni
18.97
-0.103
-0.54%
1 gen 1966 anni
19.012
+0.042
0.22%
1 gen 1967 anni
18.697
-0.314
-1.65%
1 gen 1968 anni
18.524
-0.173
-0.93%
1 gen 1969 anni
21.304
+2.78
15.01%
1 gen 1970 anni
22.703
+1.399
6.57%
1 gen 1971 anni
23.852
+1.149
5.06%
1 gen 1972 anni
22.551
-1.301
-5.45%
1 gen 1973 anni
23.636
+1.084
4.81%
1 gen 1974 anni
23.587
-0.049
-0.21%
1 gen 1975 anni
25.662
+2.075
8.8%
1 gen 1976 anni
22.117
-3.545
-13.81%
1 gen 1977 anni
23.53
+1.412
6.39%
1 gen 1978 anni
26.831
+3.302
14.03%
1 gen 1979 anni
27.84
+1.008
3.76%
1 gen 1980 anni
29.557
+1.717
6.17%
1 gen 1981 anni
30.8
+1.243
4.21%
1 gen 1982 anni
31.265
+0.465
1.51%
1 gen 1983 anni
28.855
-2.409
-7.71%
1 gen 1984 anni
28.682
-0.174
-0.6%
1 gen 1985 anni
29.465
+0.783
2.73%
1 gen 1986 anni
27.969
-1.495
-5.07%
1 gen 1987 anni
25.628
-2.341
-8.37%
1 gen 1988 anni
24.986
-0.642
-2.51%
1 gen 1989 anni
23.896
-1.09
-4.36%
1 gen 1990 anni
23.013
-0.883
-3.69%
1 gen 1991 anni
22.134
-0.879
-3.82%
1 gen 1992 anni
21.254
-0.88
-3.97%
1 gen 1993 anni
25.523
+4.269
20.09%
1 gen 1994 anni
31.366
+5.843
22.89%
1 gen 1995 anni
34.029
+2.662
8.49%
1 gen 1996 anni
35.762
+1.734
5.1%
1 gen 1997 anni
36.328
+0.565
1.58%
1 gen 1998 anni
37.801
+1.473
4.06%
1 gen 1999 anni
37.467
-0.334
-0.88%
1 gen 2000 anni
37.602
+0.135
0.36%
1 gen 2001 anni
42.087
+4.485
11.93%
1 gen 2002 anni
39.713
-2.374
-5.64%
1 gen 2003 anni
39.086
-0.627
-1.58%
1 gen 2004 anni
37.266
-1.82
-4.66%
1 gen 2005 anni
38.589
+1.323
3.55%
1 gen 2006 anni
40.256
+1.666
4.32%
1 gen 2007 anni
43.171
+2.915
7.24%
1 gen 2008 anni
43.997
+0.826
1.91%
1 gen 2009 anni
45.078
+1.081
2.46%
1 gen 2010 anni
36.271
-8.807
-19.54%
1 gen 2011 anni
38.678
+2.407
6.64%
1 gen 2012 anni
39.16
+0.482
1.25%
1 gen 2013 anni
39.481
+0.322
0.82%
1 gen 2014 anni
38.814
-0.667
-1.69%
1 gen 2015 anni
37.679
-1.135
-2.92%
1 gen 2016 anni
36.615
-1.065
-2.83%
Classificazione dei paesi secondo i statistiche attuali per anni


Commenti: