29
/it/
it
AIzaSyAYiBZKx7MnpbEhh9jyipgxe19OcubqV5w
April 1, 2024
43380
Latin America & the Caribbean (IDA & IBRD countries)
TLA
false
2
1
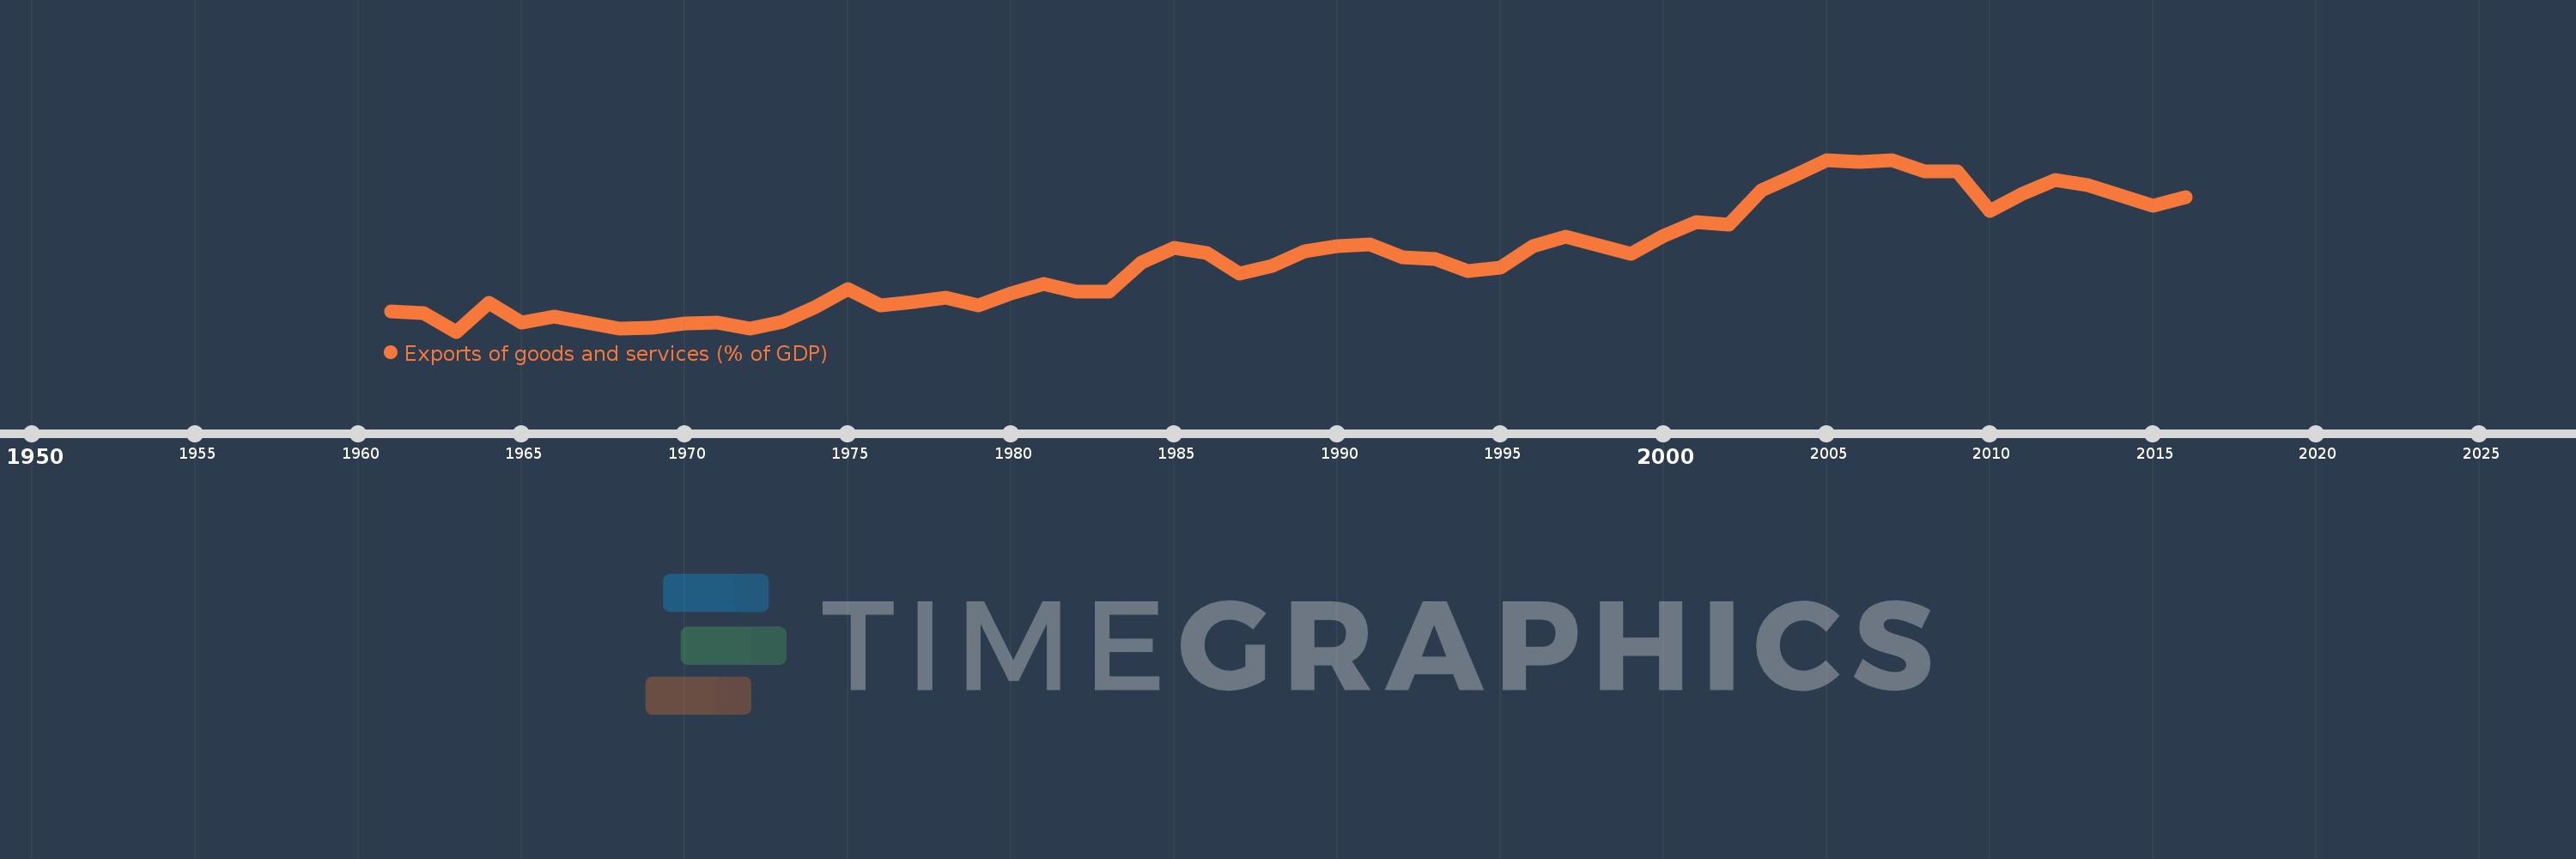
Exports of goods and services (% of GDP)
2016,2015,2014,2013,2012,2011,2010,2009,2008,2007,2006,2005,2004,2003,2002,2001,2000,1999,1998,1997,1996,1995,1994,1993,1992,1991,1990,1989,1988,1987,1986,1985,1984,1983,1982,1981,1980,1979,1978,1977,1976,1975,1974,1973,1972,1971,1970,1969,1968,1967,1966,1965,1964,1963,1962,1961
Queste statistiche in altri paesi:
AfghanistanAlbaniaAlgeriaAngolaAntigua and BarbudaArab WorldArgentinaArmeniaArubaAustraliaAustriaAzerbaijanBahamas, TheBahrainBangladeshBarbadosBelarusBelgiumBelizeBeninBermudaBhutanBoliviaBosnia and HerzegovinaBotswanaBrazilBrunei DarussalamBulgariaBurkina FasoBurundiCabo VerdeCambodiaCameroonCanadaCaribbean small statesCentral African RepublicCentral Europe and the BalticsChadChileChinaColombiaComorosCongo, Dem. Rep.Congo, Rep.Costa RicaCote d'IvoireCroatiaCubaCyprusCzech RepublicDenmarkDjiboutiDominicaDominican RepublicEarly-demographic dividendEast Asia & PacificEast Asia & Pacific (excluding high income)East Asia & Pacific (IDA & IBRD countries)EcuadorEgypt, Arab Rep.El SalvadorEquatorial GuineaEritreaEstoniaEthiopiaEuro areaEurope & Central AsiaEurope & Central Asia (excluding high income)Europe & Central Asia (IDA & IBRD countries)European UnionFaroe IslandsFijiFinlandFragile and conflict affected situationsFranceFrench PolynesiaGabonGambia, TheGeorgiaGermanyGhanaGreeceGrenadaGuatemalaGuineaGuinea-BissauGuyanaHaitiHeavily indebted poor countries (HIPC)High incomeHondurasHong Kong SAR, ChinaHungaryIBRD onlyIcelandIDA & IBRD totalIDA blendIDA onlyIDA totalIndiaIndonesiaIran, Islamic Rep.IraqIrelandIsraelItalyJamaicaJapanJordanKazakhstanKenyaKiribatiKorea, Rep.KosovoKuwaitKyrgyz RepublicLao PDRLate-demographic dividendLatin America & Caribbean Latin America & Caribbean (excluding high income)Latin America & the Caribbean (IDA & IBRD countries)LatviaLeast developed countries: UN classificationLebanonLesothoLiberiaLibyaLithuaniaLow & middle incomeLow incomeLower middle incomeLuxembourgMacao SAR, ChinaMacedonia, FYRMadagascarMalawiMalaysiaMaldivesMaliMaltaMauritaniaMauritiusMexicoMicronesia, Fed. Sts.Middle East & North AfricaMiddle East & North Africa (excluding high income)Middle East & North Africa (IDA & IBRD countries)Middle incomeMoldovaMongoliaMontenegroMoroccoMozambiqueMyanmarNamibiaNepalNetherlandsNew CaledoniaNew ZealandNicaraguaNigerNigeriaNorth AmericaNorwayOECD membersOmanOther small statesPacific island small statesPakistanPalauPanamaPapua New GuineaParaguayPeruPhilippinesPolandPortugalPost-demographic dividendPre-demographic dividendPuerto RicoQatarRomaniaRussian FederationRwandaSamoaSaudi ArabiaSenegalSerbiaSeychellesSierra LeoneSingaporeSlovak RepublicSloveniaSmall statesSolomon IslandsSomaliaSouth AfricaSouth AsiaSouth Asia (IDA & IBRD)South SudanSpainSri LankaSt. Kitts and NevisSt. LuciaSt. Vincent and the GrenadinesSub-Saharan Africa Sub-Saharan Africa (excluding high income)Sub-Saharan Africa (IDA & IBRD countries)SudanSurinameSwazilandSwedenSwitzerlandSyrian Arab RepublicTajikistanTanzaniaThailandTimor-LesteTogoTongaTrinidad and TobagoTunisiaTurkeyTurkmenistanUgandaUkraineUnited Arab EmiratesUnited KingdomUnited StatesUpper middle incomeUruguayUzbekistanVanuatuVenezuela, RBVietnamWest Bank and GazaWorldYemen, Rep.ZambiaZimbabwe Linea del tempo:
Questa scala temporale mostra un grafico dal 1961 anno al 2016 anno. Latin America & the Caribbean (IDA & IBRD countries). I dati fino ad 1960 anno non disponibili. Il numero di osservazioni attuali secondo i date: 56.
La fonte (nome):
Indicatori dello sviluppo mondiale
La fonte (organizzazione):
World Bank national accounts data, and OECD National Accounts data files.
Categorie:
Economy & Growth, Trade
sono stati aggiornati
23 apr 2017 anni
Indicatori delle variazioni dei valori per anni
Minima:
9.618
1 gen 1963 anni
Massimo:
23.542
1 gen 2005 anni
Alla data di osservazione
Valore
Variazione assoluta
La variazione rispetto al valore precedente
1 gen 1961 anni
11.251
+11.251
0.0%
1 gen 1962 anni
11.121
-0.13
-1.16%
1 gen 1963 anni
9.618
-1.503
-13.51%
1 gen 1964 anni
11.92
+2.302
23.93%
1 gen 1965 anni
10.33
-1.59
-13.34%
1 gen 1966 anni
10.818
+0.489
4.73%
1 gen 1967 anni
10.379
-0.439
-4.06%
1 gen 1968 anni
9.837
-0.542
-5.22%
1 gen 1969 anni
9.934
+0.097
0.98%
1 gen 1970 anni
10.254
+0.32
3.23%
1 gen 1971 anni
10.358
+0.104
1.01%
1 gen 1972 anni
9.852
-0.507
-4.89%
1 gen 1973 anni
10.45
+0.599
6.08%
1 gen 1974 anni
11.629
+1.178
11.28%
1 gen 1975 anni
13.072
+1.443
12.41%
1 gen 1976 anni
11.767
-1.305
-9.99%
1 gen 1977 anni
12.021
+0.254
2.16%
1 gen 1978 anni
12.336
+0.315
2.62%
1 gen 1979 anni
11.769
-0.567
-4.6%
1 gen 1980 anni
12.697
+0.928
7.88%
1 gen 1981 anni
13.461
+0.764
6.02%
1 gen 1982 anni
12.823
-0.637
-4.74%
1 gen 1983 anni
12.872
+0.049
0.38%
1 gen 1984 anni
15.204
+2.332
18.11%
1 gen 1985 anni
16.382
+1.178
7.75%
1 gen 1986 anni
15.983
-0.399
-2.44%
1 gen 1987 anni
14.351
-1.633
-10.21%
1 gen 1988 anni
14.95
+0.599
4.17%
1 gen 1989 anni
16.109
+1.159
7.76%
1 gen 1990 anni
16.566
+0.457
2.84%
1 gen 1991 anni
16.678
+0.112
0.68%
1 gen 1992 anni
15.635
-1.044
-6.26%
1 gen 1993 anni
15.531
-0.103
-0.66%
1 gen 1994 anni
14.506
-1.026
-6.6%
1 gen 1995 anni
14.797
+0.292
2.01%
1 gen 1996 anni
16.521
+1.723
11.64%
1 gen 1997 anni
17.302
+0.782
4.73%
1 gen 1998 anni
16.609
-0.693
-4.01%
1 gen 1999 anni
15.928
-0.681
-4.1%
1 gen 2000 anni
17.346
+1.418
8.9%
1 gen 2001 anni
18.507
+1.161
6.69%
1 gen 2002 anni
18.257
-0.25
-1.35%
1 gen 2003 anni
21.097
+2.84
15.55%
1 gen 2004 anni
22.282
+1.185
5.62%
1 gen 2005 anni
23.542
+1.259
5.65%
1 gen 2006 anni
23.401
-0.141
-0.6%
1 gen 2007 anni
23.492
+0.091
0.39%
1 gen 2008 anni
22.58
-0.912
-3.88%
1 gen 2009 anni
22.593
+0.013
0.06%
1 gen 2010 anni
19.387
-3.207
-14.19%
1 gen 2011 anni
20.813
+1.426
7.36%
1 gen 2012 anni
21.895
+1.082
5.2%
1 gen 2013 anni
21.481
-0.415
-1.89%
1 gen 2014 anni
20.674
-0.807
-3.76%
1 gen 2015 anni
19.791
-0.883
-4.27%
1 gen 2016 anni
20.481
+0.69
3.49%
Classificazione dei paesi secondo i statistiche attuali per anni


Commenti: