29
/it/
it
AIzaSyAYiBZKx7MnpbEhh9jyipgxe19OcubqV5w
April 1, 2024
35692
High income
HIC
false
2
1
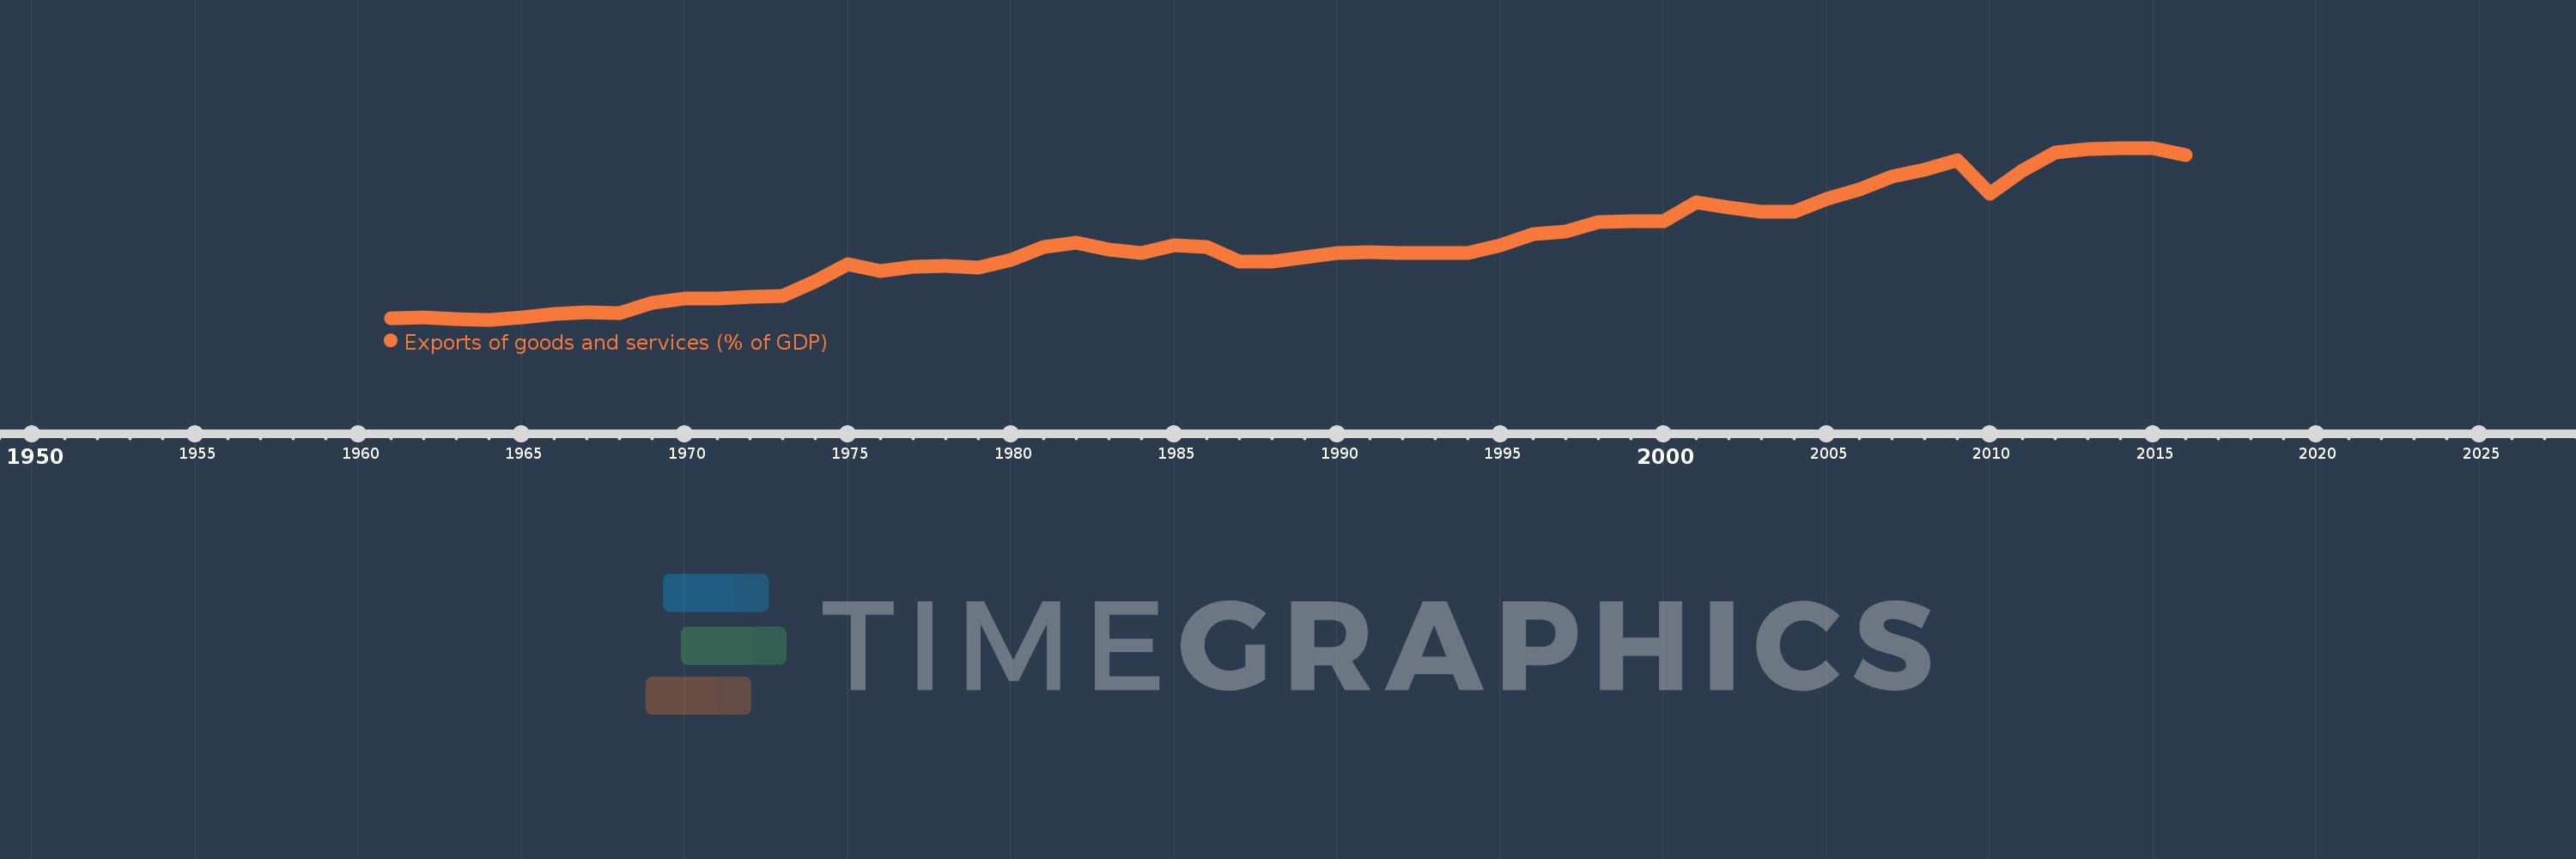
Exports of goods and services (% of GDP)
2016,2015,2014,2013,2012,2011,2010,2009,2008,2007,2006,2005,2004,2003,2002,2001,2000,1999,1998,1997,1996,1995,1994,1993,1992,1991,1990,1989,1988,1987,1986,1985,1984,1983,1982,1981,1980,1979,1978,1977,1976,1975,1974,1973,1972,1971,1970,1969,1968,1967,1966,1965,1964,1963,1962,1961
Queste statistiche in altri paesi:
AfghanistanAlbaniaAlgeriaAngolaAntigua and BarbudaArab WorldArgentinaArmeniaArubaAustraliaAustriaAzerbaijanBahamas, TheBahrainBangladeshBarbadosBelarusBelgiumBelizeBeninBermudaBhutanBoliviaBosnia and HerzegovinaBotswanaBrazilBrunei DarussalamBulgariaBurkina FasoBurundiCabo VerdeCambodiaCameroonCanadaCaribbean small statesCentral African RepublicCentral Europe and the BalticsChadChileChinaColombiaComorosCongo, Dem. Rep.Congo, Rep.Costa RicaCote d'IvoireCroatiaCubaCyprusCzech RepublicDenmarkDjiboutiDominicaDominican RepublicEarly-demographic dividendEast Asia & PacificEast Asia & Pacific (excluding high income)East Asia & Pacific (IDA & IBRD countries)EcuadorEgypt, Arab Rep.El SalvadorEquatorial GuineaEritreaEstoniaEthiopiaEuro areaEurope & Central AsiaEurope & Central Asia (excluding high income)Europe & Central Asia (IDA & IBRD countries)European UnionFaroe IslandsFijiFinlandFragile and conflict affected situationsFranceFrench PolynesiaGabonGambia, TheGeorgiaGermanyGhanaGreeceGrenadaGuatemalaGuineaGuinea-BissauGuyanaHaitiHeavily indebted poor countries (HIPC)High incomeHondurasHong Kong SAR, ChinaHungaryIBRD onlyIcelandIDA & IBRD totalIDA blendIDA onlyIDA totalIndiaIndonesiaIran, Islamic Rep.IraqIrelandIsraelItalyJamaicaJapanJordanKazakhstanKenyaKiribatiKorea, Rep.KosovoKuwaitKyrgyz RepublicLao PDRLate-demographic dividendLatin America & Caribbean Latin America & Caribbean (excluding high income)Latin America & the Caribbean (IDA & IBRD countries)LatviaLeast developed countries: UN classificationLebanonLesothoLiberiaLibyaLithuaniaLow & middle incomeLow incomeLower middle incomeLuxembourgMacao SAR, ChinaMacedonia, FYRMadagascarMalawiMalaysiaMaldivesMaliMaltaMauritaniaMauritiusMexicoMicronesia, Fed. Sts.Middle East & North AfricaMiddle East & North Africa (excluding high income)Middle East & North Africa (IDA & IBRD countries)Middle incomeMoldovaMongoliaMontenegroMoroccoMozambiqueMyanmarNamibiaNepalNetherlandsNew CaledoniaNew ZealandNicaraguaNigerNigeriaNorth AmericaNorwayOECD membersOmanOther small statesPacific island small statesPakistanPalauPanamaPapua New GuineaParaguayPeruPhilippinesPolandPortugalPost-demographic dividendPre-demographic dividendPuerto RicoQatarRomaniaRussian FederationRwandaSamoaSaudi ArabiaSenegalSerbiaSeychellesSierra LeoneSingaporeSlovak RepublicSloveniaSmall statesSolomon IslandsSomaliaSouth AfricaSouth AsiaSouth Asia (IDA & IBRD)South SudanSpainSri LankaSt. Kitts and NevisSt. LuciaSt. Vincent and the GrenadinesSub-Saharan Africa Sub-Saharan Africa (excluding high income)Sub-Saharan Africa (IDA & IBRD countries)SudanSurinameSwazilandSwedenSwitzerlandSyrian Arab RepublicTajikistanTanzaniaThailandTimor-LesteTogoTongaTrinidad and TobagoTunisiaTurkeyTurkmenistanUgandaUkraineUnited Arab EmiratesUnited KingdomUnited StatesUpper middle incomeUruguayUzbekistanVanuatuVenezuela, RBVietnamWest Bank and GazaWorldYemen, Rep.ZambiaZimbabwe Linea del tempo:
Questa scala temporale mostra un grafico dal 1961 anno al 2016 anno. High income. I dati fino ad 1960 anno non disponibili. Il numero di osservazioni attuali secondo i date: 56.
La fonte (nome):
Indicatori dello sviluppo mondiale
La fonte (organizzazione):
World Bank national accounts data, and OECD National Accounts data files.
Categorie:
Economy & Growth, Trade
sono stati aggiornati
23 apr 2017 anni
Indicatori delle variazioni dei valori per anni
Minima:
12.792
1 gen 1964 anni
Massimo:
32.048
1 gen 2014 anni
Alla data di osservazione
Valore
Variazione assoluta
La variazione rispetto al valore precedente
1 gen 1961 anni
12.944
+12.944
0.0%
1 gen 1962 anni
13.017
+0.073
0.57%
1 gen 1963 anni
12.877
-0.14
-1.07%
1 gen 1964 anni
12.792
-0.086
-0.66%
1 gen 1965 anni
13.009
+0.217
1.7%
1 gen 1966 anni
13.406
+0.396
3.05%
1 gen 1967 anni
13.648
+0.243
1.81%
1 gen 1968 anni
13.498
-0.151
-1.11%
1 gen 1969 anni
14.656
+1.159
8.58%
1 gen 1970 anni
15.168
+0.512
3.49%
1 gen 1971 anni
15.214
+0.046
0.3%
1 gen 1972 anni
15.334
+0.12
0.79%
1 gen 1973 anni
15.425
+0.091
0.59%
1 gen 1974 anni
17.079
+1.654
10.72%
1 gen 1975 anni
18.982
+1.904
11.15%
1 gen 1976 anni
18.259
-0.724
-3.81%
1 gen 1977 anni
18.754
+0.495
2.71%
1 gen 1978 anni
18.836
+0.082
0.44%
1 gen 1979 anni
18.603
-0.233
-1.24%
1 gen 1980 anni
19.528
+0.925
4.97%
1 gen 1981 anni
20.978
+1.45
7.42%
1 gen 1982 anni
21.389
+0.412
1.96%
1 gen 1983 anni
20.621
-0.768
-3.59%
1 gen 1984 anni
20.233
-0.388
-1.88%
1 gen 1985 anni
21.131
+0.898
4.44%
1 gen 1986 anni
20.904
-0.227
-1.08%
1 gen 1987 anni
19.304
-1.6
-7.65%
1 gen 1988 anni
19.346
+0.042
0.22%
1 gen 1989 anni
19.754
+0.408
2.11%
1 gen 1990 anni
20.245
+0.491
2.49%
1 gen 1991 anni
20.382
+0.137
0.68%
1 gen 1992 anni
20.225
-0.156
-0.77%
1 gen 1993 anni
20.252
+0.026
0.13%
1 gen 1994 anni
20.27
+0.019
0.09%
1 gen 1995 anni
21.117
+0.846
4.17%
1 gen 1996 anni
22.371
+1.255
5.94%
1 gen 1997 anni
22.645
+0.274
1.22%
1 gen 1998 anni
23.736
+1.091
4.82%
1 gen 1999 anni
23.788
+0.052
0.22%
1 gen 2000 anni
23.804
+0.016
0.07%
1 gen 2001 anni
25.92
+2.116
8.89%
1 gen 2002 anni
25.41
-0.51
-1.97%
1 gen 2003 anni
24.872
-0.538
-2.12%
1 gen 2004 anni
24.904
+0.033
0.13%
1 gen 2005 anni
26.328
+1.423
5.72%
1 gen 2006 anni
27.366
+1.038
3.94%
1 gen 2007 anni
28.841
+1.474
5.39%
1 gen 2008 anni
29.605
+0.764
2.65%
1 gen 2009 anni
30.658
+1.053
3.56%
1 gen 2010 anni
26.915
-3.743
-12.21%
1 gen 2011 anni
29.56
+2.645
9.83%
1 gen 2012 anni
31.528
+1.968
6.66%
1 gen 2013 anni
31.945
+0.417
1.32%
1 gen 2014 anni
32.048
+0.103
0.32%
1 gen 2015 anni
32.02
-0.027
-0.08%
1 gen 2016 anni
31.23
-0.79
-2.47%
Classificazione dei paesi secondo i statistiche attuali per anni


Commenti: