29
/it/
it
AIzaSyAYiBZKx7MnpbEhh9jyipgxe19OcubqV5w
April 1, 2024
230971
Rwanda
RWA
true
2
1
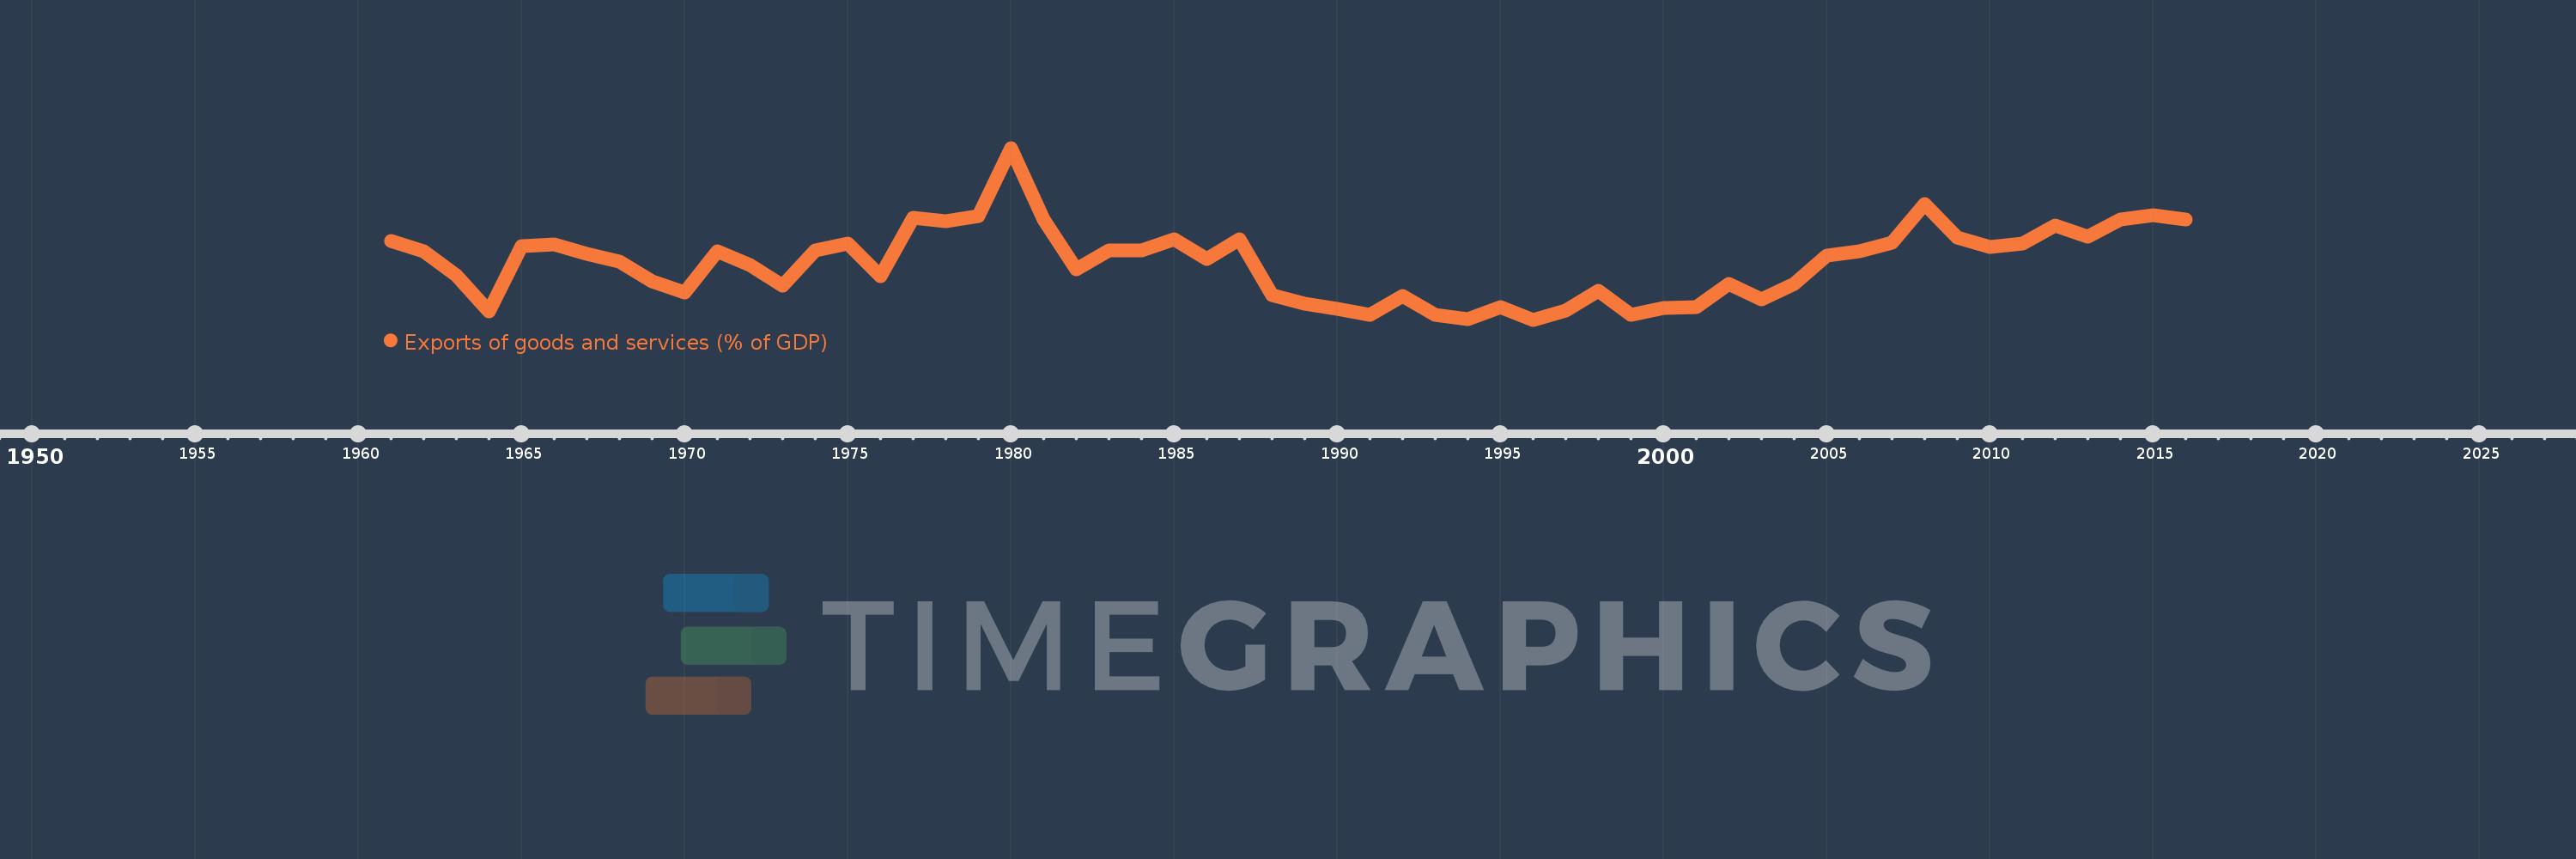
Exports of goods and services (% of GDP)
2016,2015,2014,2013,2012,2011,2010,2009,2008,2007,2006,2005,2004,2003,2002,2001,2000,1999,1998,1997,1996,1995,1994,1993,1992,1991,1990,1989,1988,1987,1986,1985,1984,1983,1982,1981,1980,1979,1978,1977,1976,1975,1974,1973,1972,1971,1970,1969,1968,1967,1966,1965,1964,1963,1962,1961
Queste statistiche in altri paesi:
AfghanistanAlbaniaAlgeriaAngolaAntigua and BarbudaArab WorldArgentinaArmeniaArubaAustraliaAustriaAzerbaijanBahamas, TheBahrainBangladeshBarbadosBelarusBelgiumBelizeBeninBermudaBhutanBoliviaBosnia and HerzegovinaBotswanaBrazilBrunei DarussalamBulgariaBurkina FasoBurundiCabo VerdeCambodiaCameroonCanadaCaribbean small statesCentral African RepublicCentral Europe and the BalticsChadChileChinaColombiaComorosCongo, Dem. Rep.Congo, Rep.Costa RicaCote d'IvoireCroatiaCubaCyprusCzech RepublicDenmarkDjiboutiDominicaDominican RepublicEarly-demographic dividendEast Asia & PacificEast Asia & Pacific (excluding high income)East Asia & Pacific (IDA & IBRD countries)EcuadorEgypt, Arab Rep.El SalvadorEquatorial GuineaEritreaEstoniaEthiopiaEuro areaEurope & Central AsiaEurope & Central Asia (excluding high income)Europe & Central Asia (IDA & IBRD countries)European UnionFaroe IslandsFijiFinlandFragile and conflict affected situationsFranceFrench PolynesiaGabonGambia, TheGeorgiaGermanyGhanaGreeceGrenadaGuatemalaGuineaGuinea-BissauGuyanaHaitiHeavily indebted poor countries (HIPC)High incomeHondurasHong Kong SAR, ChinaHungaryIBRD onlyIcelandIDA & IBRD totalIDA blendIDA onlyIDA totalIndiaIndonesiaIran, Islamic Rep.IraqIrelandIsraelItalyJamaicaJapanJordanKazakhstanKenyaKiribatiKorea, Rep.KosovoKuwaitKyrgyz RepublicLao PDRLate-demographic dividendLatin America & Caribbean Latin America & Caribbean (excluding high income)Latin America & the Caribbean (IDA & IBRD countries)LatviaLeast developed countries: UN classificationLebanonLesothoLiberiaLibyaLithuaniaLow & middle incomeLow incomeLower middle incomeLuxembourgMacao SAR, ChinaMacedonia, FYRMadagascarMalawiMalaysiaMaldivesMaliMaltaMauritaniaMauritiusMexicoMicronesia, Fed. Sts.Middle East & North AfricaMiddle East & North Africa (excluding high income)Middle East & North Africa (IDA & IBRD countries)Middle incomeMoldovaMongoliaMontenegroMoroccoMozambiqueMyanmarNamibiaNepalNetherlandsNew CaledoniaNew ZealandNicaraguaNigerNigeriaNorth AmericaNorwayOECD membersOmanOther small statesPacific island small statesPakistanPalauPanamaPapua New GuineaParaguayPeruPhilippinesPolandPortugalPost-demographic dividendPre-demographic dividendPuerto RicoQatarRomaniaRussian FederationRwandaSamoaSaudi ArabiaSenegalSerbiaSeychellesSierra LeoneSingaporeSlovak RepublicSloveniaSmall statesSolomon IslandsSomaliaSouth AfricaSouth AsiaSouth Asia (IDA & IBRD)South SudanSpainSri LankaSt. Kitts and NevisSt. LuciaSt. Vincent and the GrenadinesSub-Saharan Africa Sub-Saharan Africa (excluding high income)Sub-Saharan Africa (IDA & IBRD countries)SudanSurinameSwazilandSwedenSwitzerlandSyrian Arab RepublicTajikistanTanzaniaThailandTimor-LesteTogoTongaTrinidad and TobagoTunisiaTurkeyTurkmenistanUgandaUkraineUnited Arab EmiratesUnited KingdomUnited StatesUpper middle incomeUruguayUzbekistanVanuatuVenezuela, RBVietnamWest Bank and GazaWorldYemen, Rep.ZambiaZimbabwe Linea del tempo:
Questa scala temporale mostra un grafico dal 1961 anno al 2016 anno. Rwanda. I dati fino ad 1960 anno non disponibili. Il numero di osservazioni attuali secondo i date: 56.
La fonte (nome):
Indicatori dello sviluppo mondiale
La fonte (organizzazione):
World Bank national accounts data, and OECD National Accounts data files.
Categorie:
Economy & Growth, Trade
sono stati aggiornati
23 apr 2017 anni
Indicatori delle variazioni dei valori per anni
Minima:
5.151
1 gen 1996 anni
Massimo:
21.046
1 gen 1980 anni
Alla data di osservazione
Valore
Variazione assoluta
La variazione rispetto al valore precedente
1 gen 1961 anni
12.437
+12.437
0.0%
1 gen 1962 anni
11.475
-0.962
-7.73%
1 gen 1963 anni
9.28
-2.195
-19.13%
1 gen 1964 anni
5.938
-3.342
-36.02%
1 gen 1965 anni
12.0
+6.063
102.11%
1 gen 1966 anni
12.097
+0.097
0.81%
1 gen 1967 anni
11.279
-0.817
-6.76%
1 gen 1968 anni
10.512
-0.767
-6.8%
1 gen 1969 anni
8.74
-1.772
-16.86%
1 gen 1970 anni
7.679
-1.061
-12.14%
1 gen 1971 anni
11.505
+3.826
49.83%
1 gen 1972 anni
10.211
-1.294
-11.25%
1 gen 1973 anni
8.282
-1.929
-18.9%
1 gen 1974 anni
11.598
+3.316
40.04%
1 gen 1975 anni
12.169
+0.57
4.92%
1 gen 1976 anni
9.172
-2.997
-24.63%
1 gen 1977 anni
14.579
+5.407
58.95%
1 gen 1978 anni
14.268
-0.311
-2.13%
1 gen 1979 anni
14.781
+0.513
3.6%
1 gen 1980 anni
21.046
+6.265
42.39%
1 gen 1981 anni
14.437
-6.61
-31.41%
1 gen 1982 anni
9.826
-4.611
-31.94%
1 gen 1983 anni
11.553
+1.727
17.58%
1 gen 1984 anni
11.582
+0.029
0.25%
1 gen 1985 anni
12.631
+1.05
9.06%
1 gen 1986 anni
10.783
-1.849
-14.64%
1 gen 1987 anni
12.584
+1.802
16.71%
1 gen 1988 anni
7.45
-5.134
-40.8%
1 gen 1989 anni
6.62
-0.83
-11.15%
1 gen 1990 anni
6.139
-0.48
-7.26%
1 gen 1991 anni
5.615
-0.525
-8.55%
1 gen 1992 anni
7.317
+1.702
30.31%
1 gen 1993 anni
5.568
-1.748
-23.89%
1 gen 1994 anni
5.175
-0.393
-7.06%
1 gen 1995 anni
6.303
+1.127
21.78%
1 gen 1996 anni
5.151
-1.152
-18.27%
1 gen 1997 anni
6.031
+0.881
17.1%
1 gen 1998 anni
7.797
+1.766
29.28%
1 gen 1999 anni
5.585
-2.212
-28.37%
1 gen 2000 anni
6.222
+0.637
11.41%
1 gen 2001 anni
6.32
+0.098
1.57%
1 gen 2002 anni
8.479
+2.159
34.16%
1 gen 2003 anni
7.035
-1.443
-17.02%
1 gen 2004 anni
8.453
+1.418
20.16%
1 gen 2005 anni
11.124
+2.671
31.59%
1 gen 2006 anni
11.458
+0.334
3.01%
1 gen 2007 anni
12.296
+0.838
7.31%
1 gen 2008 anni
15.884
+3.588
29.18%
1 gen 2009 anni
12.734
-3.15
-19.83%
1 gen 2010 anni
11.899
-0.834
-6.55%
1 gen 2011 anni
12.188
+0.289
2.42%
1 gen 2012 anni
13.859
+1.671
13.71%
1 gen 2013 anni
12.875
-0.984
-7.1%
1 gen 2014 anni
14.433
+1.558
12.1%
1 gen 2015 anni
14.791
+0.359
2.49%
1 gen 2016 anni
14.425
-0.366
-2.48%
Classificazione dei paesi secondo i statistiche attuali per anni


Commenti: