29
/fr/
fr
AIzaSyAYiBZKx7MnpbEhh9jyipgxe19OcubqV5w
April 1, 2024
98872
Cambodia
KHM
true
2
1
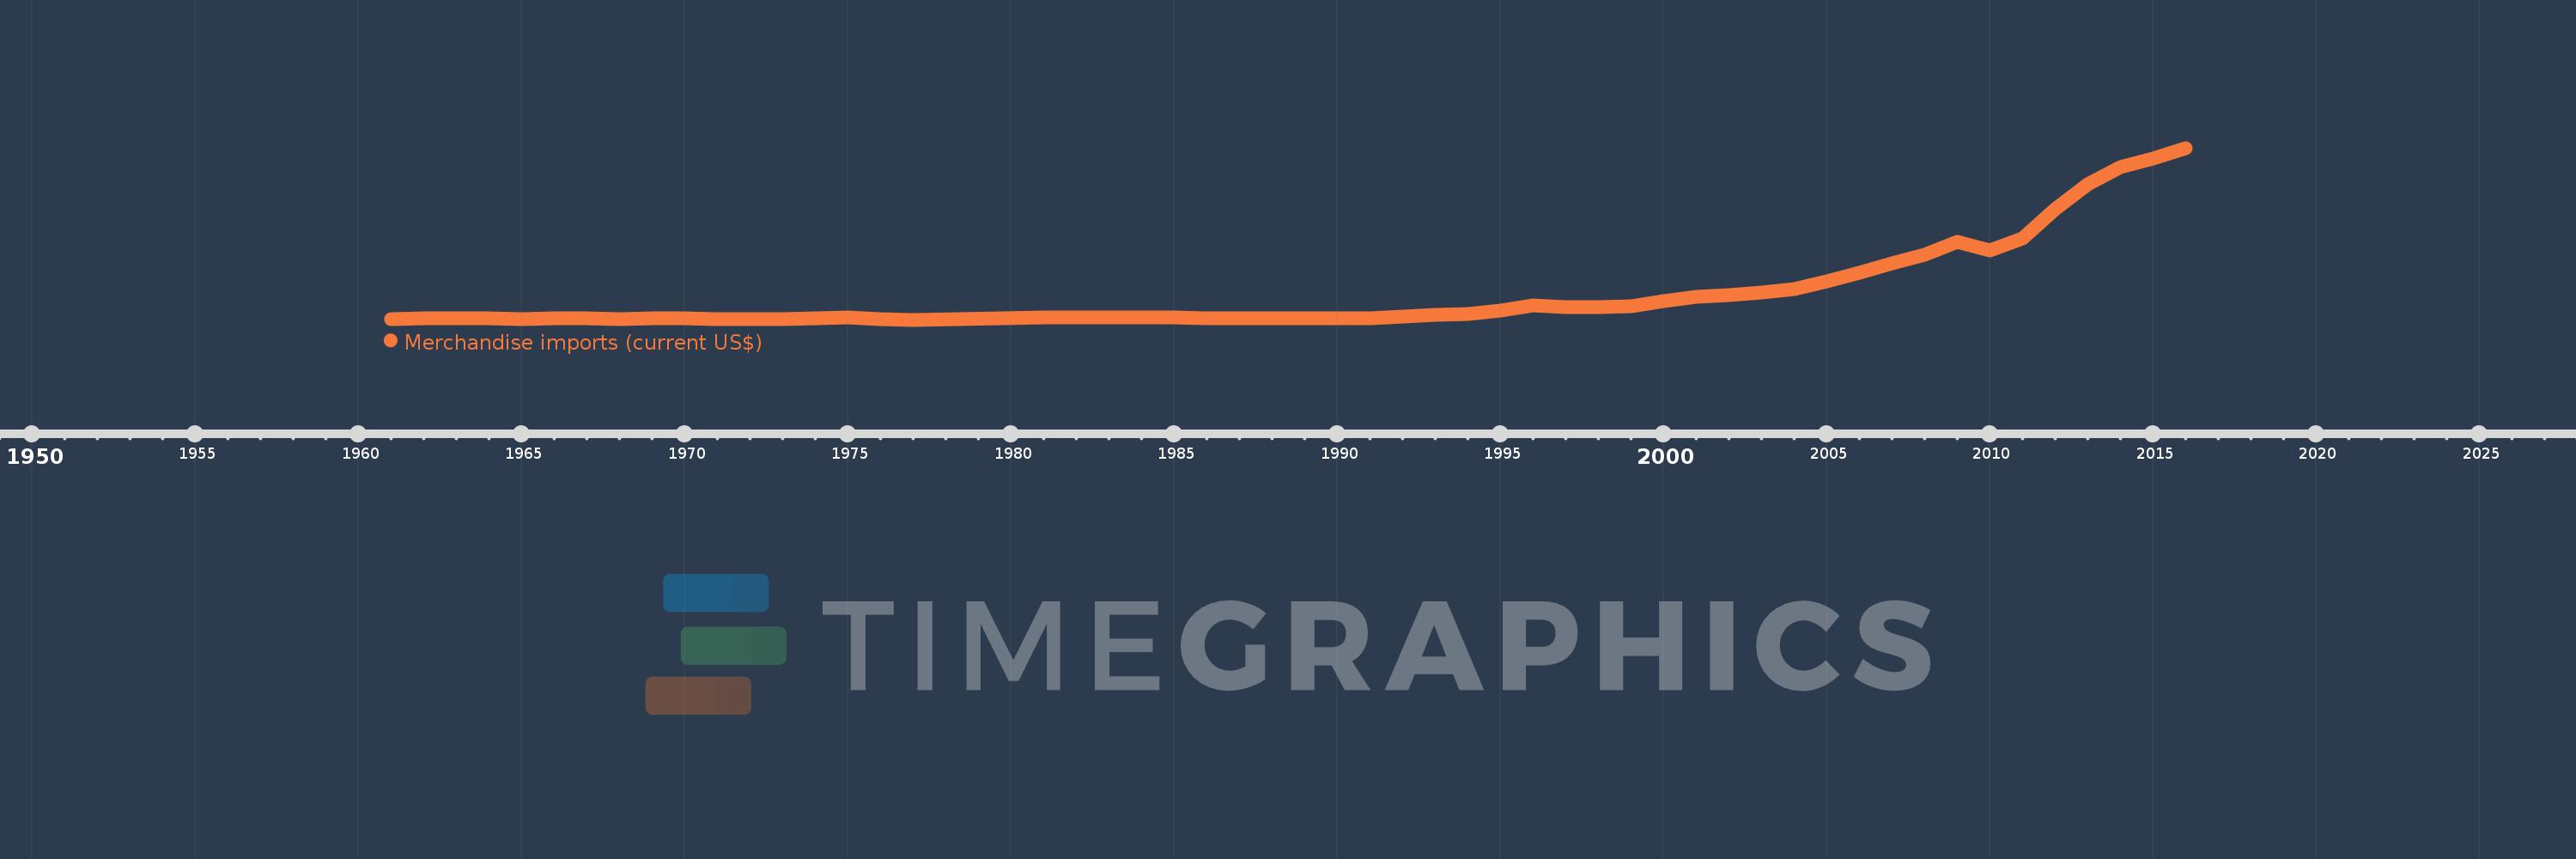
Merchandise imports (current US$)
2016,2015,2014,2013,2012,2011,2010,2009,2008,2007,2006,2005,2004,2003,2002,2001,2000,1999,1998,1997,1996,1995,1994,1993,1992,1991,1990,1989,1988,1987,1986,1985,1984,1983,1982,1981,1977,1976,1975,1974,1973,1972,1971,1970,1969,1968,1967,1966,1965,1964,1963,1962,1961
Cette statistique dans les autres pays:
AfghanistanAlbaniaAlgeriaAmerican SamoaAngolaAntigua and BarbudaArab WorldArgentinaArmeniaArubaAustraliaAustriaAzerbaijanBahamas, TheBahrainBangladeshBarbadosBelarusBelgiumBelizeBeninBermudaBhutanBoliviaBosnia and HerzegovinaBotswanaBrazilBrunei DarussalamBulgariaBurkina FasoBurundiCabo VerdeCambodiaCameroonCanadaCaribbean small statesCentral African RepublicCentral Europe and the BalticsChadChileChinaColombiaComorosCongo, Dem. Rep.Congo, Rep.Costa RicaCote d'IvoireCroatiaCubaCuracaoCyprusCzech RepublicDenmarkDjiboutiDominicaDominican RepublicEarly-demographic dividendEast Asia & PacificEast Asia & Pacific (excluding high income)East Asia & Pacific (IDA & IBRD countries)EcuadorEgypt, Arab Rep.El SalvadorEquatorial GuineaEritreaEstoniaEthiopiaEuro areaEurope & Central AsiaEurope & Central Asia (excluding high income)Europe & Central Asia (IDA & IBRD countries)European UnionFaroe IslandsFijiFinlandFragile and conflict affected situationsFranceFrench PolynesiaGabonGambia, TheGeorgiaGermanyGhanaGreeceGreenlandGrenadaGuatemalaGuineaGuinea-BissauGuyanaHaitiHeavily indebted poor countries (HIPC)High incomeHondurasHong Kong SAR, ChinaHungaryIBRD onlyIcelandIDA & IBRD totalIDA blendIDA onlyIDA totalIndiaIndonesiaIran, Islamic Rep.IraqIrelandIsraelItalyJamaicaJapanJordanKazakhstanKenyaKiribatiKorea, Dem. People’s Rep.Korea, Rep.KuwaitKyrgyz RepublicLao PDRLate-demographic dividendLatin America & Caribbean Latin America & Caribbean (excluding high income)Latin America & the Caribbean (IDA & IBRD countries)LatviaLeast developed countries: UN classificationLebanonLesothoLiberiaLibyaLithuaniaLow & middle incomeLow incomeLower middle incomeLuxembourgMacao SAR, ChinaMacedonia, FYRMadagascarMalawiMalaysiaMaldivesMaliMaltaMarshall IslandsMauritaniaMauritiusMexicoMicronesia, Fed. Sts.Middle East & North AfricaMiddle East & North Africa (excluding high income)Middle East & North Africa (IDA & IBRD countries)Middle incomeMoldovaMongoliaMontenegroMoroccoMozambiqueMyanmarNamibiaNepalNetherlandsNew CaledoniaNew ZealandNicaraguaNigerNigeriaNorth AmericaNorthern Mariana IslandsNorwayOECD membersOmanOther small statesPacific island small statesPakistanPalauPanamaPapua New GuineaParaguayPeruPhilippinesPolandPortugalPost-demographic dividendPre-demographic dividendQatarRomaniaRussian FederationRwandaSamoaSao Tome and PrincipeSaudi ArabiaSenegalSerbiaSeychellesSierra LeoneSingaporeSint Maarten (Dutch part)Slovak RepublicSloveniaSmall statesSolomon IslandsSouth AfricaSouth AsiaSouth Asia (IDA & IBRD)SpainSri LankaSt. Kitts and NevisSt. LuciaSt. Martin (French part)St. Vincent and the GrenadinesSub-Saharan Africa Sub-Saharan Africa (excluding high income)Sub-Saharan Africa (IDA & IBRD countries)SudanSurinameSwazilandSwedenSwitzerlandSyrian Arab RepublicTajikistanTanzaniaThailandTimor-LesteTogoTongaTrinidad and TobagoTunisiaTurkeyTurkmenistanTuvaluUgandaUkraineUnited Arab EmiratesUnited KingdomUnited StatesUpper middle incomeUruguayUzbekistanVanuatuVenezuela, RBVietnamWorldYemen, Rep.ZambiaZimbabwe La ligne de temps
Cette échelle de temps montre un graphique de 1961 année à 2016 année Cambodia. Les données jusqu'à 1960 année ne sont pas présentés. Quantité d'observations actuelles selon dates: 53.
Source (désignation):
Les indicateurs du développement mondiale
Source (organisation):
World Trade Organization.
Catégories:
Private Sector, Trade
Dernière mise à jour
23 avr. 2017
Les indicateurs de changement de valeurs selon les années
Minimum:
10.0 mln.
1 janv. 1977
Maximum:
14.4 mds
1 janv. 2016
Pour la date d''observation
Valeur
Changement absolu
Le changement par rapport à la valeur précédente
1 janv. 1961
95.0 mln.
+95.0 mln.
0.0%
1 janv. 1962
97.0 mln.
+2.0 mln.
2.11%
1 janv. 1963
102.0 mln.
+5.0 mln.
5.15%
1 janv. 1964
107.0 mln.
+5.0 mln.
4.9%
1 janv. 1965
82.0 mln.
-25.0 mln.
-23.36%
1 janv. 1966
103.0 mln.
+21.0 mln.
25.61%
1 janv. 1967
111.0 mln.
+8.0 mln.
7.77%
1 janv. 1968
96.0 mln.
-15.0 mln.
-13.51%
1 janv. 1969
116.0 mln.
+20.0 mln.
20.83%
1 janv. 1970
102.0 mln.
-14.0 mln.
-12.07%
1 janv. 1971
54.0 mln.
-48.0 mln.
-47.06%
1 janv. 1972
57.0 mln.
+3.0 mln.
5.56%
1 janv. 1973
80.0 mln.
+23.0 mln.
40.35%
1 janv. 1974
150.0 mln.
+70.0 mln.
87.5%
1 janv. 1975
180.0 mln.
+30.0 mln.
20.0%
1 janv. 1976
60.0 mln.
-120.0 mln.
-66.67%
1 janv. 1977
10.0 mln.
-50.0 mln.
-83.33%
1 janv. 1981
180.0 mln.
+170.0 mln.
1.7 milles%
1 janv. 1982
180.0 mln.
0.0
0.0%
1 janv. 1983
180.0 mln.
0.0
0.0%
1 janv. 1984
180.0 mln.
0.0
0.0%
1 janv. 1985
180.0 mln.
0.0
0.0%
1 janv. 1986
120.0 mln.
-60.0 mln.
-33.33%
1 janv. 1987
140.0 mln.
+20.0 mln.
16.67%
1 janv. 1988
140.0 mln.
0.0
0.0%
1 janv. 1989
127.0 mln.
-13.0 mln.
-9.29%
1 janv. 1990
135.0 mln.
+8.0 mln.
6.3%
1 janv. 1991
164.0 mln.
+29.0 mln.
21.48%
1 janv. 1992
245.0 mln.
+81.0 mln.
49.39%
1 janv. 1993
443.0 mln.
+198.0 mln.
80.82%
1 janv. 1994
471.0 mln.
+28.0 mln.
6.32%
1 janv. 1995
744.0 mln.
+273.0 mln.
57.96%
1 janv. 1996
1.187 mds
+443.0 mln.
59.54%
1 janv. 1997
1.072 mds
-115.0 mln.
-9.69%
1 janv. 1998
1.064 mds
-8.0 mln.
-0.75%
1 janv. 1999
1.166 mds
+102.0 mln.
9.59%
1 janv. 2000
1.591 mds
+425.0 mln.
36.45%
1 janv. 2001
1.939 mds
+348.0 mln.
21.87%
1 janv. 2002
2.094 mds
+155.0 mln.
7.99%
1 janv. 2003
2.318 mds
+224.0 mln.
10.7%
1 janv. 2004
2.56 mds
+241.94 mln.
10.44%
1 janv. 2005
3.193 mds
+633.35 mln.
24.74%
1 janv. 2006
3.927 mds
+733.71 mln.
22.98%
1 janv. 2007
4.771 mds
+844.24 mln.
21.5%
1 janv. 2008
5.439 mds
+667.63 mln.
13.99%
1 janv. 2009
6.508 mds
+1.07 mds
19.66%
1 janv. 2010
5.83 mds
-677.964 mln.
-10.42%
1 janv. 2011
6.791 mds
+960.275 mln.
16.47%
1 janv. 2012
9.3 mds
+2.509 mds
36.95%
1 janv. 2013
11.35 mds
+2.05 mds
22.04%
1 janv. 2014
12.8 mds
+1.45 mds
12.78%
1 janv. 2015
13.5 mds
+700.0 mln.
5.47%
1 janv. 2016
14.4 mds
+900.0 mln.
6.67%
Classement des pays selon les statistiques actuelles par années


Commentaires: