29
/fr/
fr
AIzaSyAYiBZKx7MnpbEhh9jyipgxe19OcubqV5w
April 1, 2024
154898
India
IND
true
2
1
Merchandise imports (current US$)
2016,2015,2014,2013,2012,2011,2010,2009,2008,2007,2006,2005,2004,2003,2002,2001,2000,1999,1998,1997,1996,1995,1994,1993,1992,1991,1990,1989,1988,1987,1986,1985,1984,1983,1982,1981,1980,1979,1978,1977,1976,1975,1974,1973,1972,1971,1970,1969,1968,1967,1966,1965,1964,1963,1962,1961
Cette statistique dans les autres pays:
AfghanistanAlbaniaAlgeriaAmerican SamoaAngolaAntigua and BarbudaArab WorldArgentinaArmeniaArubaAustraliaAustriaAzerbaijanBahamas, TheBahrainBangladeshBarbadosBelarusBelgiumBelizeBeninBermudaBhutanBoliviaBosnia and HerzegovinaBotswanaBrazilBrunei DarussalamBulgariaBurkina FasoBurundiCabo VerdeCambodiaCameroonCanadaCaribbean small statesCentral African RepublicCentral Europe and the BalticsChadChileChinaColombiaComorosCongo, Dem. Rep.Congo, Rep.Costa RicaCote d'IvoireCroatiaCubaCuracaoCyprusCzech RepublicDenmarkDjiboutiDominicaDominican RepublicEarly-demographic dividendEast Asia & PacificEast Asia & Pacific (excluding high income)East Asia & Pacific (IDA & IBRD countries)EcuadorEgypt, Arab Rep.El SalvadorEquatorial GuineaEritreaEstoniaEthiopiaEuro areaEurope & Central AsiaEurope & Central Asia (excluding high income)Europe & Central Asia (IDA & IBRD countries)European UnionFaroe IslandsFijiFinlandFragile and conflict affected situationsFranceFrench PolynesiaGabonGambia, TheGeorgiaGermanyGhanaGreeceGreenlandGrenadaGuatemalaGuineaGuinea-BissauGuyanaHaitiHeavily indebted poor countries (HIPC)High incomeHondurasHong Kong SAR, ChinaHungaryIBRD onlyIcelandIDA & IBRD totalIDA blendIDA onlyIDA totalIndiaIndonesiaIran, Islamic Rep.IraqIrelandIsraelItalyJamaicaJapanJordanKazakhstanKenyaKiribatiKorea, Dem. People’s Rep.Korea, Rep.KuwaitKyrgyz RepublicLao PDRLate-demographic dividendLatin America & Caribbean Latin America & Caribbean (excluding high income)Latin America & the Caribbean (IDA & IBRD countries)LatviaLeast developed countries: UN classificationLebanonLesothoLiberiaLibyaLithuaniaLow & middle incomeLow incomeLower middle incomeLuxembourgMacao SAR, ChinaMacedonia, FYRMadagascarMalawiMalaysiaMaldivesMaliMaltaMarshall IslandsMauritaniaMauritiusMexicoMicronesia, Fed. Sts.Middle East & North AfricaMiddle East & North Africa (excluding high income)Middle East & North Africa (IDA & IBRD countries)Middle incomeMoldovaMongoliaMontenegroMoroccoMozambiqueMyanmarNamibiaNepalNetherlandsNew CaledoniaNew ZealandNicaraguaNigerNigeriaNorth AmericaNorthern Mariana IslandsNorwayOECD membersOmanOther small statesPacific island small statesPakistanPalauPanamaPapua New GuineaParaguayPeruPhilippinesPolandPortugalPost-demographic dividendPre-demographic dividendQatarRomaniaRussian FederationRwandaSamoaSao Tome and PrincipeSaudi ArabiaSenegalSerbiaSeychellesSierra LeoneSingaporeSint Maarten (Dutch part)Slovak RepublicSloveniaSmall statesSolomon IslandsSouth AfricaSouth AsiaSouth Asia (IDA & IBRD)SpainSri LankaSt. Kitts and NevisSt. LuciaSt. Martin (French part)St. Vincent and the GrenadinesSub-Saharan Africa Sub-Saharan Africa (excluding high income)Sub-Saharan Africa (IDA & IBRD countries)SudanSurinameSwazilandSwedenSwitzerlandSyrian Arab RepublicTajikistanTanzaniaThailandTimor-LesteTogoTongaTrinidad and TobagoTunisiaTurkeyTurkmenistanTuvaluUgandaUkraineUnited Arab EmiratesUnited KingdomUnited StatesUpper middle incomeUruguayUzbekistanVanuatuVenezuela, RBVietnamWorldYemen, Rep.ZambiaZimbabwe La ligne de temps
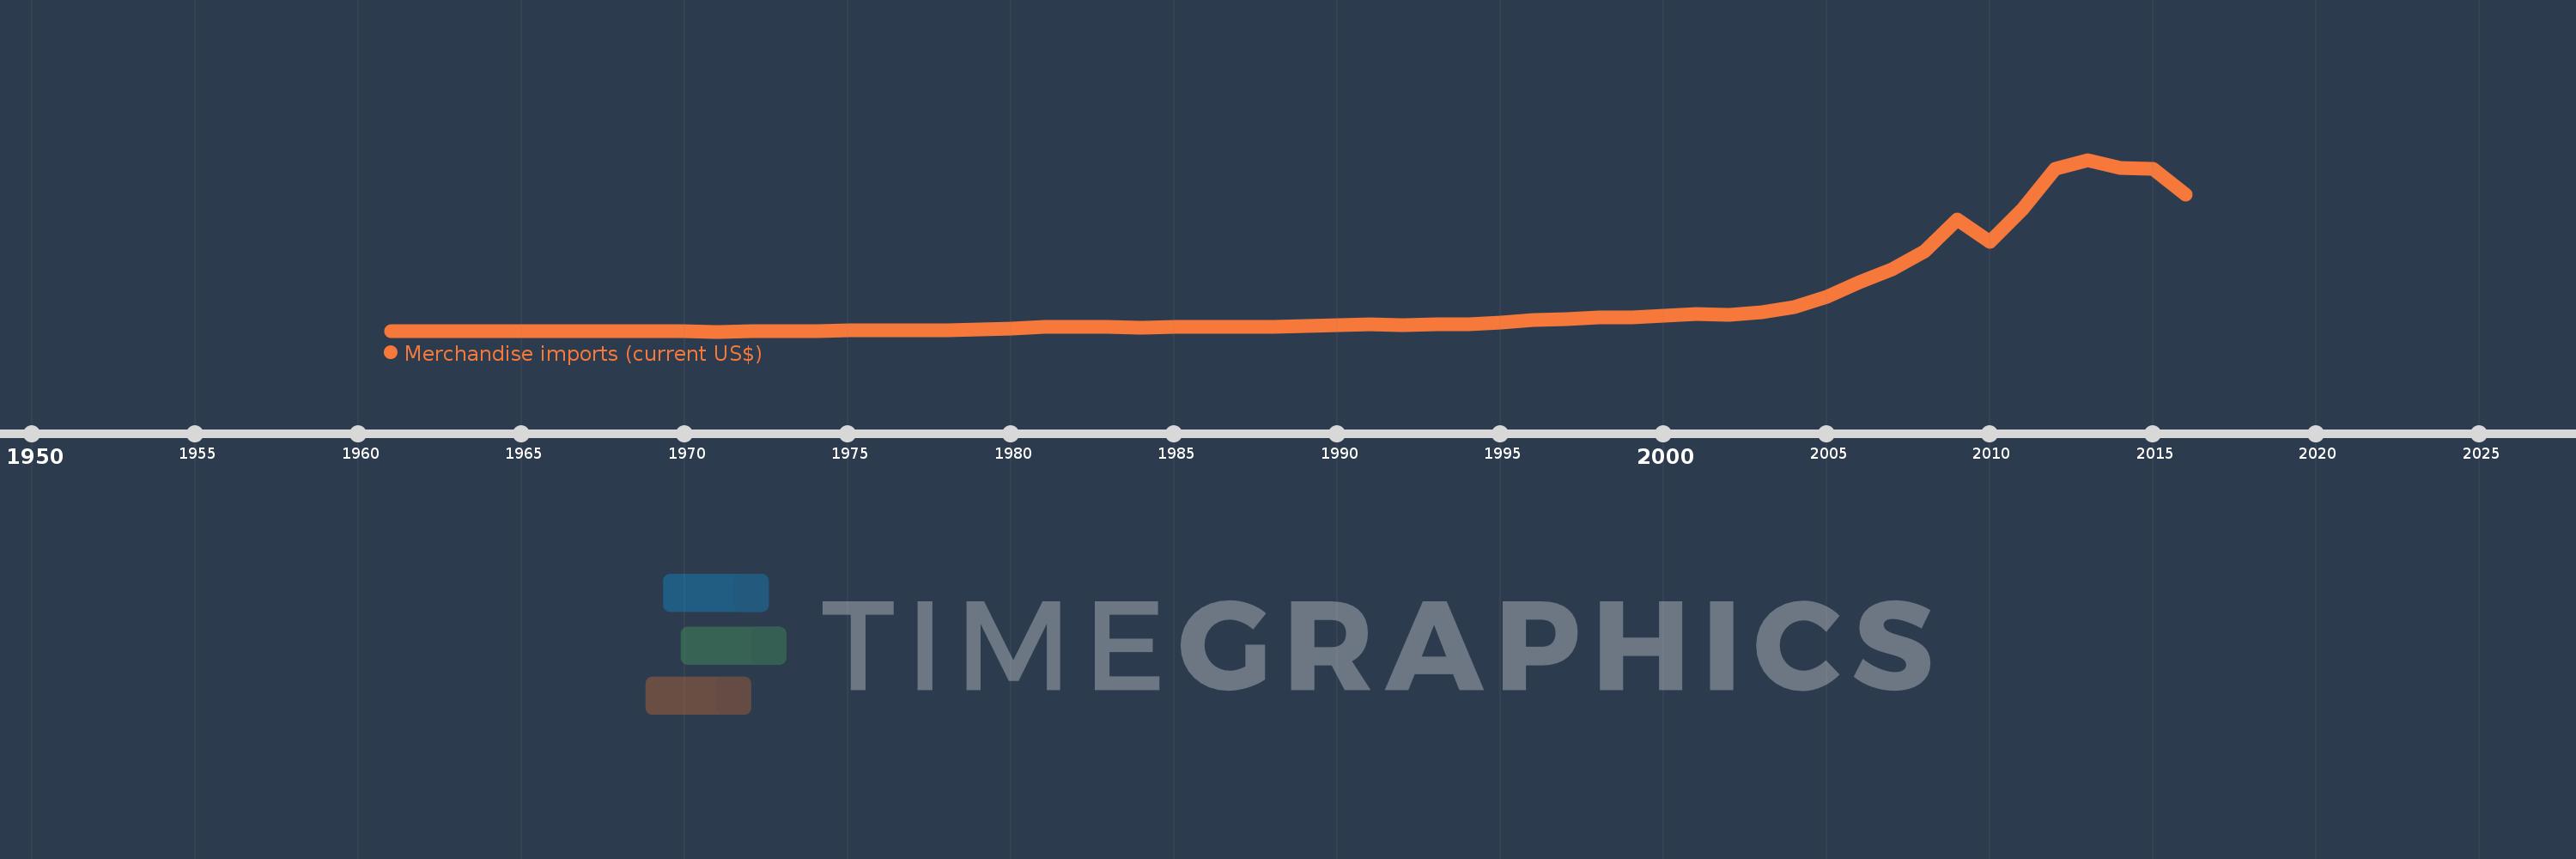
Cette échelle de temps montre un graphique de 1961 année à 2016 année India. Les données jusqu'à 1960 année ne sont pas présentés. Quantité d'observations actuelles selon dates: 56.
Source (désignation):
Les indicateurs du développement mondiale
Source (organisation):
World Trade Organization.
Catégories:
Private Sector, Trade
Dernière mise à jour
23 avr. 2017
Les indicateurs de changement de valeurs selon les années
Minimum:
2.124 mds
1 janv. 1971
Maximum:
489.694 mds
1 janv. 2013
Pour la date d''observation
Valeur
Changement absolu
Le changement par rapport à la valeur précédente
1 janv. 1961
2.303 mds
+2.303 mds
0.0%
1 janv. 1962
2.286 mds
-17.64 mln.
-0.77%
1 janv. 1963
2.362 mds
+76.44 mln.
3.34%
1 janv. 1964
2.477 mds
+115.08 mln.
4.87%
1 janv. 1965
2.876 mds
+398.37 mln.
16.08%
1 janv. 1966
2.838 mds
-37.17 mln.
-1.29%
1 janv. 1967
3.44 mds
+601.47 mln.
21.19%
1 janv. 1968
2.773 mds
-667.03 mln.
-19.39%
1 janv. 1969
2.57 mds
-203.07 mln.
-7.32%
1 janv. 1970
2.212 mds
-357.86 mln.
-13.93%
1 janv. 1971
2.124 mds
-87.47 mln.
-3.95%
1 janv. 1972
2.424 mds
+299.3 mln.
14.09%
1 janv. 1973
2.223 mds
-200.46 mln.
-8.27%
1 janv. 1974
3.211 mds
+987.71 mln.
44.43%
1 janv. 1975
5.136 mds
+1.925 mds
59.95%
1 janv. 1976
6.381 mds
+1.245 mds
24.24%
1 janv. 1977
5.665 mds
-715.71 mln.
-11.22%
1 janv. 1978
6.647 mds
+981.68 mln.
17.33%
1 janv. 1979
7.865 mds
+1.218 mds
18.33%
1 janv. 1980
9.827 mds
+1.963 mds
24.95%
1 janv. 1981
14.864 mds
+5.037 mds
51.25%
1 janv. 1982
15.418 mds
+554.0 mln.
3.73%
1 janv. 1983
14.786 mds
-632.0 mln.
-4.1%
1 janv. 1984
14.061 mds
-725.0 mln.
-4.9%
1 janv. 1985
15.323 mds
+1.262 mds
8.98%
1 janv. 1986
15.928 mds
+605.0 mln.
3.95%
1 janv. 1987
15.421 mds
-507.0 mln.
-3.18%
1 janv. 1988
16.675 mds
+1.254 mds
8.13%
1 janv. 1989
19.149 mds
+2.474 mds
14.84%
1 janv. 1990
20.535 mds
+1.386 mds
7.24%
1 janv. 1991
23.58 mds
+3.045 mds
14.83%
1 janv. 1992
20.448 mds
-3.132 mds
-13.28%
1 janv. 1993
23.579 mds
+3.131 mds
15.31%
1 janv. 1994
22.788 mds
-791.0 mln.
-3.35%
1 janv. 1995
26.843 mds
+4.055 mds
17.79%
1 janv. 1996
34.707 mds
+7.864 mds
29.3%
1 janv. 1997
37.942 mds
+3.235 mds
9.32%
1 janv. 1998
41.432 mds
+3.49 mds
9.2%
1 janv. 1999
42.98 mds
+1.548 mds
3.74%
1 janv. 2000
46.979 mds
+3.999 mds
9.3%
1 janv. 2001
51.523 mds
+4.544 mds
9.67%
1 janv. 2002
50.392 mds
-1.131 mds
-2.2%
1 janv. 2003
56.517 mds
+6.125 mds
12.15%
1 janv. 2004
72.558 mds
+16.041 mds
28.38%
1 janv. 2005
99.775 mds
+27.218 mds
37.51%
1 janv. 2006
142.87 mds
+43.095 mds
43.19%
1 janv. 2007
178.41 mds
+35.54 mds
24.88%
1 janv. 2008
229.37 mds
+50.96 mds
28.56%
1 janv. 2009
321.031 mds
+91.662 mds
39.96%
1 janv. 2010
257.202 mds
-63.829 mds
-19.88%
1 janv. 2011
350.233 mds
+93.031 mds
36.17%
1 janv. 2012
464.462 mds
+114.229 mds
32.62%
1 janv. 2013
489.694 mds
+25.232 mds
5.43%
1 janv. 2014
465.397 mds
-24.297 mds
-4.96%
1 janv. 2015
462.91 mds
-2.487 mds
-0.53%
1 janv. 2016
391.977 mds
-70.933 mds
-15.32%
Classement des pays selon les statistiques actuelles par années


Commentaires: