29
/fr/
fr
AIzaSyAYiBZKx7MnpbEhh9jyipgxe19OcubqV5w
April 1, 2024
157569
Iran, Islamic Rep.
IRN
true
2
1
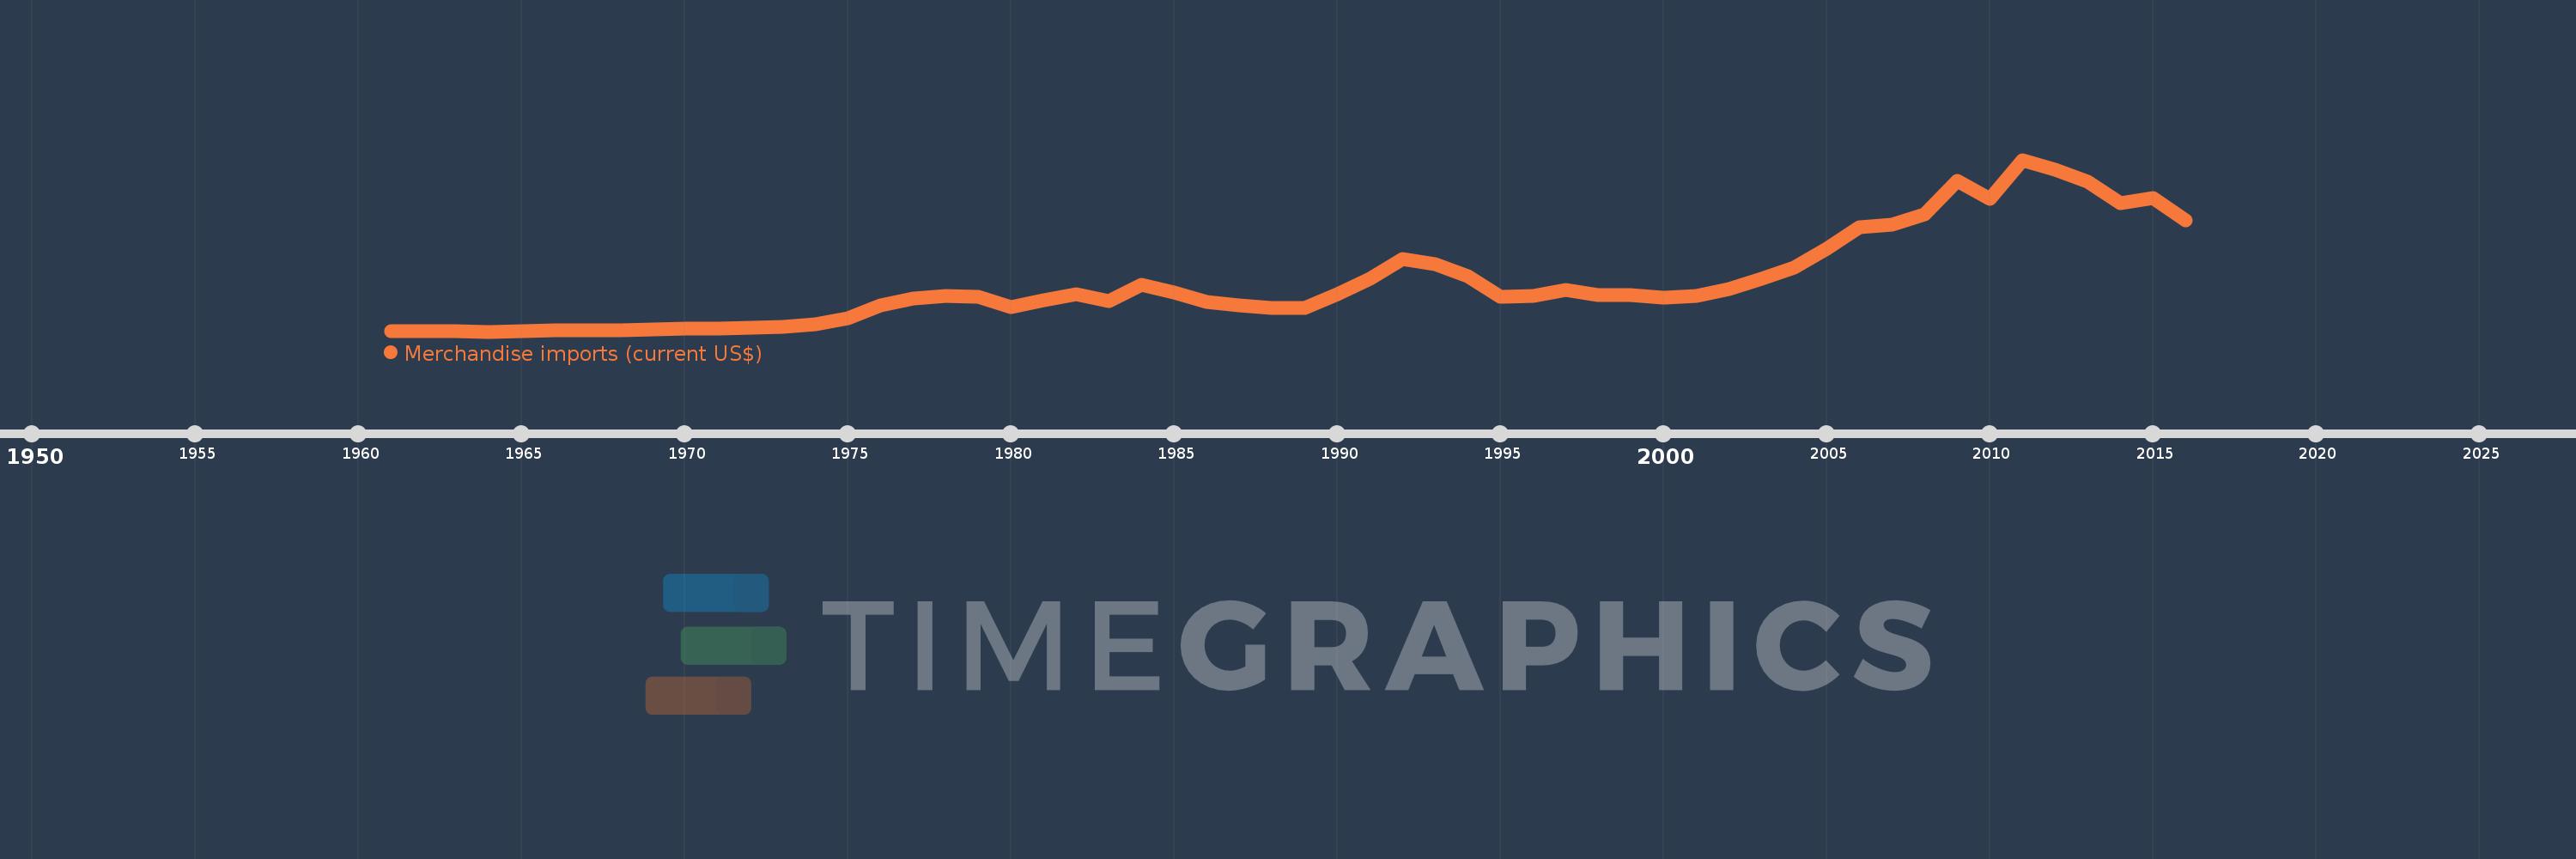
Merchandise imports (current US$)
2016,2015,2014,2013,2012,2011,2010,2009,2008,2007,2006,2005,2004,2003,2002,2001,2000,1999,1998,1997,1996,1995,1994,1993,1992,1991,1990,1989,1988,1987,1986,1985,1984,1983,1982,1981,1980,1979,1978,1977,1976,1975,1974,1973,1972,1971,1970,1969,1968,1967,1966,1965,1964,1963,1962,1961
Cette statistique dans les autres pays:
AfghanistanAlbaniaAlgeriaAmerican SamoaAngolaAntigua and BarbudaArab WorldArgentinaArmeniaArubaAustraliaAustriaAzerbaijanBahamas, TheBahrainBangladeshBarbadosBelarusBelgiumBelizeBeninBermudaBhutanBoliviaBosnia and HerzegovinaBotswanaBrazilBrunei DarussalamBulgariaBurkina FasoBurundiCabo VerdeCambodiaCameroonCanadaCaribbean small statesCentral African RepublicCentral Europe and the BalticsChadChileChinaColombiaComorosCongo, Dem. Rep.Congo, Rep.Costa RicaCote d'IvoireCroatiaCubaCuracaoCyprusCzech RepublicDenmarkDjiboutiDominicaDominican RepublicEarly-demographic dividendEast Asia & PacificEast Asia & Pacific (excluding high income)East Asia & Pacific (IDA & IBRD countries)EcuadorEgypt, Arab Rep.El SalvadorEquatorial GuineaEritreaEstoniaEthiopiaEuro areaEurope & Central AsiaEurope & Central Asia (excluding high income)Europe & Central Asia (IDA & IBRD countries)European UnionFaroe IslandsFijiFinlandFragile and conflict affected situationsFranceFrench PolynesiaGabonGambia, TheGeorgiaGermanyGhanaGreeceGreenlandGrenadaGuatemalaGuineaGuinea-BissauGuyanaHaitiHeavily indebted poor countries (HIPC)High incomeHondurasHong Kong SAR, ChinaHungaryIBRD onlyIcelandIDA & IBRD totalIDA blendIDA onlyIDA totalIndiaIndonesiaIran, Islamic Rep.IraqIrelandIsraelItalyJamaicaJapanJordanKazakhstanKenyaKiribatiKorea, Dem. People’s Rep.Korea, Rep.KuwaitKyrgyz RepublicLao PDRLate-demographic dividendLatin America & Caribbean Latin America & Caribbean (excluding high income)Latin America & the Caribbean (IDA & IBRD countries)LatviaLeast developed countries: UN classificationLebanonLesothoLiberiaLibyaLithuaniaLow & middle incomeLow incomeLower middle incomeLuxembourgMacao SAR, ChinaMacedonia, FYRMadagascarMalawiMalaysiaMaldivesMaliMaltaMarshall IslandsMauritaniaMauritiusMexicoMicronesia, Fed. Sts.Middle East & North AfricaMiddle East & North Africa (excluding high income)Middle East & North Africa (IDA & IBRD countries)Middle incomeMoldovaMongoliaMontenegroMoroccoMozambiqueMyanmarNamibiaNepalNetherlandsNew CaledoniaNew ZealandNicaraguaNigerNigeriaNorth AmericaNorthern Mariana IslandsNorwayOECD membersOmanOther small statesPacific island small statesPakistanPalauPanamaPapua New GuineaParaguayPeruPhilippinesPolandPortugalPost-demographic dividendPre-demographic dividendQatarRomaniaRussian FederationRwandaSamoaSao Tome and PrincipeSaudi ArabiaSenegalSerbiaSeychellesSierra LeoneSingaporeSint Maarten (Dutch part)Slovak RepublicSloveniaSmall statesSolomon IslandsSouth AfricaSouth AsiaSouth Asia (IDA & IBRD)SpainSri LankaSt. Kitts and NevisSt. LuciaSt. Martin (French part)St. Vincent and the GrenadinesSub-Saharan Africa Sub-Saharan Africa (excluding high income)Sub-Saharan Africa (IDA & IBRD countries)SudanSurinameSwazilandSwedenSwitzerlandSyrian Arab RepublicTajikistanTanzaniaThailandTimor-LesteTogoTongaTrinidad and TobagoTunisiaTurkeyTurkmenistanTuvaluUgandaUkraineUnited Arab EmiratesUnited KingdomUnited StatesUpper middle incomeUruguayUzbekistanVanuatuVenezuela, RBVietnamWorldYemen, Rep.ZambiaZimbabwe La ligne de temps
Cette échelle de temps montre un graphique de 1961 année à 2016 année Iran, Islamic Rep.. Les données jusqu'à 1960 année ne sont pas présentés. Quantité d'observations actuelles selon dates: 56.
Source (désignation):
Les indicateurs du développement mondiale
Source (organisation):
World Trade Organization.
Catégories:
Private Sector, Trade
Dernière mise à jour
23 avr. 2017
Les indicateurs de changement de valeurs selon les années
Minimum:
524.092 mln.
1 janv. 1964
Maximum:
65.404 mds
1 janv. 2011
Pour la date d''observation
Valeur
Changement absolu
Le changement par rapport à la valeur précédente
1 janv. 1961
650.0 mln.
+650.0 mln.
0.0%
1 janv. 1962
604.62 mln.
-45.38 mln.
-6.98%
1 janv. 1963
530.693 mln.
-73.927 mln.
-12.23%
1 janv. 1964
524.092 mln.
-6.601 mln.
-1.24%
1 janv. 1965
673.267 mln.
+149.175 mln.
28.46%
1 janv. 1966
859.406 mln.
+186.139 mln.
27.65%
1 janv. 1967
930.693 mln.
+71.287 mln.
8.29%
1 janv. 1968
1.119 mds
+188.777 mln.
20.28%
1 janv. 1969
1.383 mds
+264.03 mln.
23.59%
1 janv. 1970
1.527 mds
+143.89 mln.
10.4%
1 janv. 1971
1.662 mds
+134.66 mln.
8.82%
1 janv. 1972
1.873 mds
+211.22 mln.
12.71%
1 janv. 1973
2.409 mds
+535.97 mln.
28.61%
1 janv. 1974
3.393 mds
+983.33 mln.
40.81%
1 janv. 1975
5.433 mds
+2.04 mds
60.14%
1 janv. 1976
10.343 mds
+4.91 mds
90.38%
1 janv. 1977
12.894 mds
+2.551 mds
24.66%
1 janv. 1978
14.07 mds
+1.176 mds
9.12%
1 janv. 1979
13.55 mds
-520.8 mln.
-3.7%
1 janv. 1980
9.738 mds
-3.811 mds
-28.13%
1 janv. 1981
12.246 mds
+2.508 mds
25.75%
1 janv. 1982
14.693 mds
+2.447 mds
19.98%
1 janv. 1983
11.955 mds
-2.738 mds
-18.63%
1 janv. 1984
18.32 mds
+6.365 mds
53.24%
1 janv. 1985
15.37 mds
-2.95 mds
-16.1%
1 janv. 1986
11.635 mds
-3.735 mds
-24.3%
1 janv. 1987
10.521 mds
-1.114 mds
-9.57%
1 janv. 1988
9.57 mds
-951.0 mln.
-9.04%
1 janv. 1989
9.454 mds
-116.0 mln.
-1.21%
1 janv. 1990
14.794 mds
+5.34 mds
56.48%
1 janv. 1991
20.322 mds
+5.528 mds
37.37%
1 janv. 1992
27.927 mds
+7.605 mds
37.42%
1 janv. 1993
25.86 mds
-2.067 mds
-7.4%
1 janv. 1994
21.427 mds
-4.433 mds
-17.14%
1 janv. 1995
13.774 mds
-7.653 mds
-35.72%
1 janv. 1996
13.882 mds
+108.0 mln.
0.78%
1 janv. 1997
16.274 mds
+2.392 mds
17.23%
1 janv. 1998
14.196 mds
-2.078 mds
-12.77%
1 janv. 1999
14.323 mds
+127.0 mln.
0.89%
1 janv. 2000
13.324 mds
-999.0 mln.
-6.97%
1 janv. 2001
13.898 mds
+574.0 mln.
4.31%
1 janv. 2002
16.709 mds
+2.811 mds
20.23%
1 janv. 2003
20.617 mds
+3.908 mds
23.39%
1 janv. 2004
24.798 mds
+4.181 mds
20.28%
1 janv. 2005
31.976 mds
+7.178 mds
28.95%
1 janv. 2006
40.041 mds
+8.065 mds
25.22%
1 janv. 2007
40.772 mds
+731.0 mln.
1.83%
1 janv. 2008
44.942 mds
+4.17 mds
10.23%
1 janv. 2009
57.401 mds
+12.459 mds
27.72%
1 janv. 2010
50.768 mds
-6.633 mds
-11.56%
1 janv. 2011
65.404 mds
+14.636 mds
28.83%
1 janv. 2012
61.76 mds
-3.644 mds
-5.57%
1 janv. 2013
57.092 mds
-4.668 mds
-7.56%
1 janv. 2014
49.0 mds
-8.092 mds
-14.17%
1 janv. 2015
51.0 mds
+2.0 mds
4.08%
1 janv. 2016
42.5 mds
-8.5 mds
-16.67%
Classement des pays selon les statistiques actuelles par années


Commentaires: