29
/fr/
fr
AIzaSyAYiBZKx7MnpbEhh9jyipgxe19OcubqV5w
April 1, 2024
25088
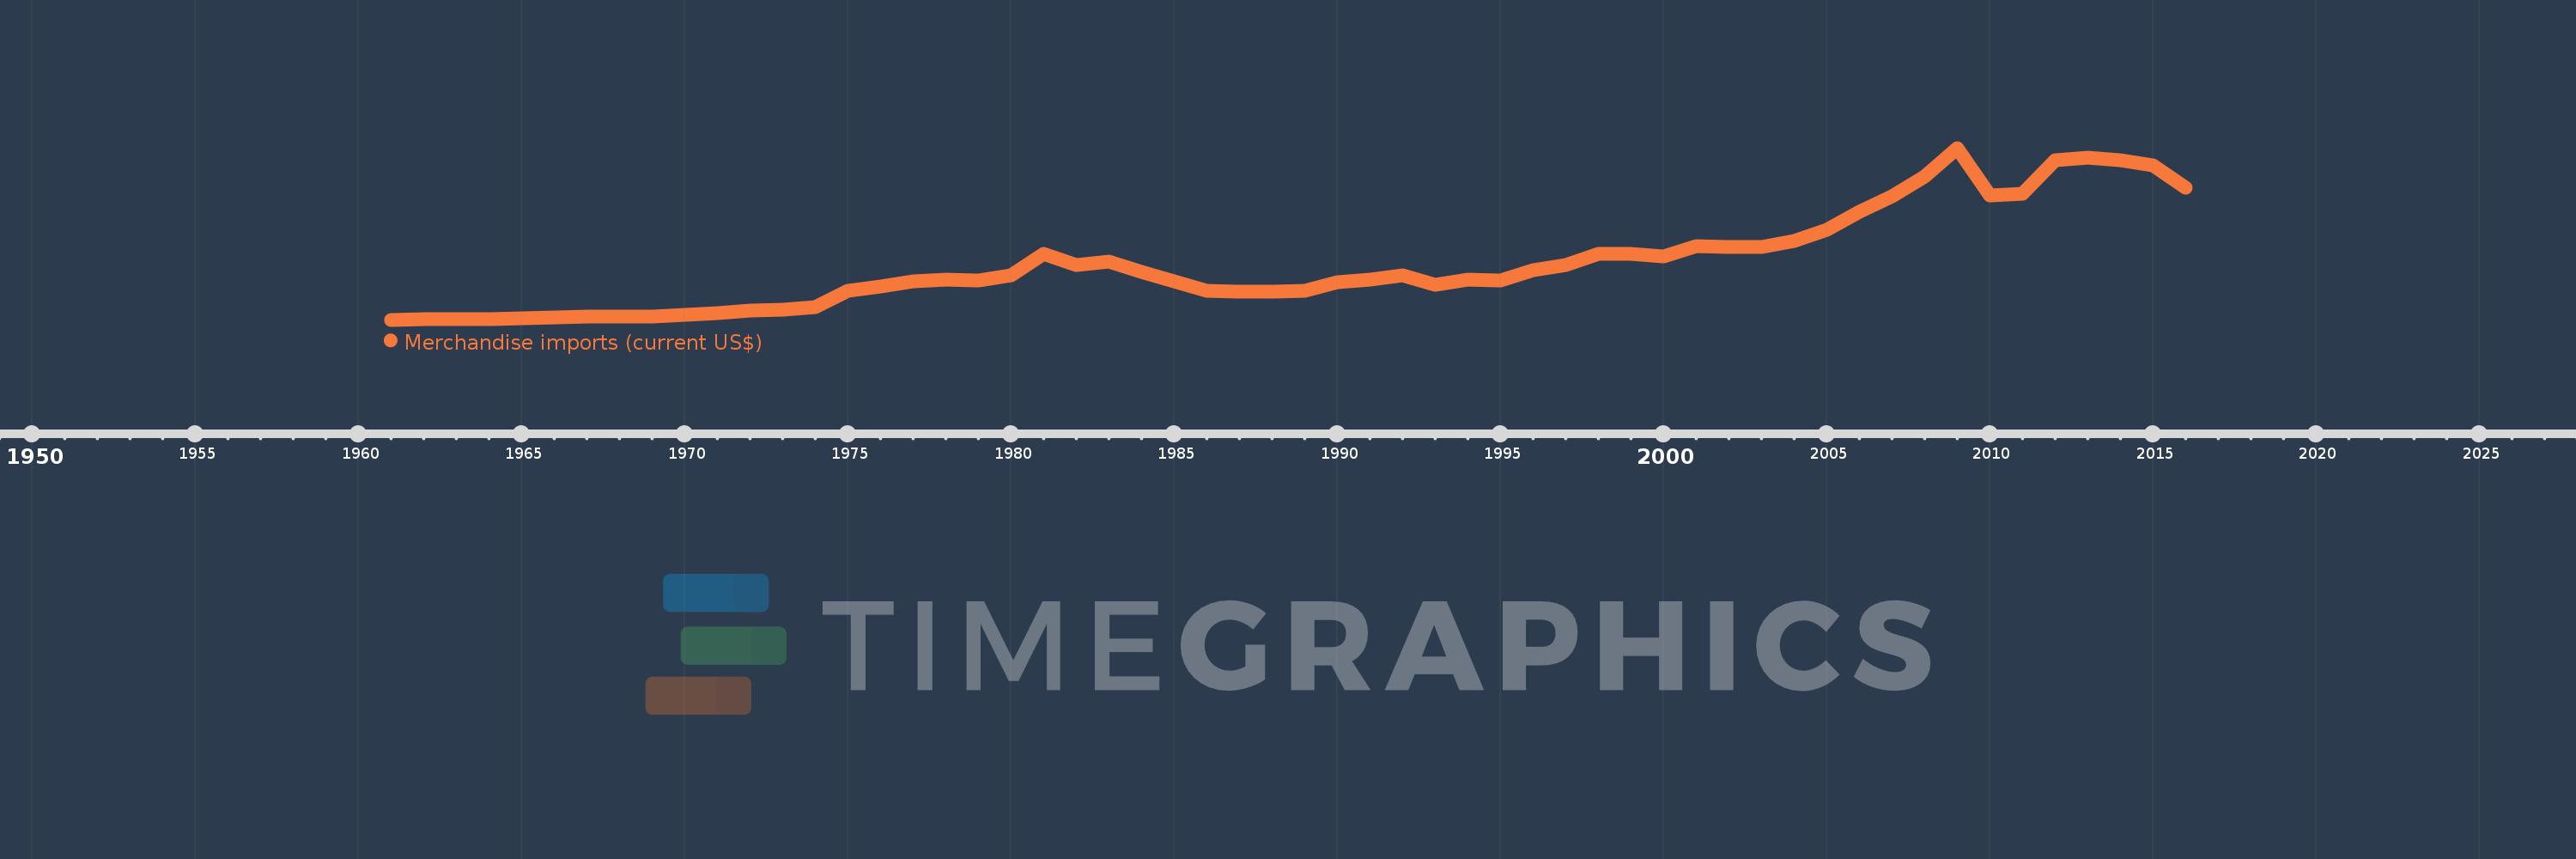
Caribbean small states
CSS
false
2
1
Merchandise imports (current US$)
2016,2015,2014,2013,2012,2011,2010,2009,2008,2007,2006,2005,2004,2003,2002,2001,2000,1999,1998,1997,1996,1995,1994,1993,1992,1991,1990,1989,1988,1987,1986,1985,1984,1983,1982,1981,1980,1979,1978,1977,1976,1975,1974,1973,1972,1971,1970,1969,1968,1967,1966,1965,1964,1963,1962,1961
Cette statistique dans les autres pays:
AfghanistanAlbaniaAlgeriaAmerican SamoaAngolaAntigua and BarbudaArab WorldArgentinaArmeniaArubaAustraliaAustriaAzerbaijanBahamas, TheBahrainBangladeshBarbadosBelarusBelgiumBelizeBeninBermudaBhutanBoliviaBosnia and HerzegovinaBotswanaBrazilBrunei DarussalamBulgariaBurkina FasoBurundiCabo VerdeCambodiaCameroonCanadaCaribbean small statesCentral African RepublicCentral Europe and the BalticsChadChileChinaColombiaComorosCongo, Dem. Rep.Congo, Rep.Costa RicaCote d'IvoireCroatiaCubaCuracaoCyprusCzech RepublicDenmarkDjiboutiDominicaDominican RepublicEarly-demographic dividendEast Asia & PacificEast Asia & Pacific (excluding high income)East Asia & Pacific (IDA & IBRD countries)EcuadorEgypt, Arab Rep.El SalvadorEquatorial GuineaEritreaEstoniaEthiopiaEuro areaEurope & Central AsiaEurope & Central Asia (excluding high income)Europe & Central Asia (IDA & IBRD countries)European UnionFaroe IslandsFijiFinlandFragile and conflict affected situationsFranceFrench PolynesiaGabonGambia, TheGeorgiaGermanyGhanaGreeceGreenlandGrenadaGuatemalaGuineaGuinea-BissauGuyanaHaitiHeavily indebted poor countries (HIPC)High incomeHondurasHong Kong SAR, ChinaHungaryIBRD onlyIcelandIDA & IBRD totalIDA blendIDA onlyIDA totalIndiaIndonesiaIran, Islamic Rep.IraqIrelandIsraelItalyJamaicaJapanJordanKazakhstanKenyaKiribatiKorea, Dem. People’s Rep.Korea, Rep.KuwaitKyrgyz RepublicLao PDRLate-demographic dividendLatin America & Caribbean Latin America & Caribbean (excluding high income)Latin America & the Caribbean (IDA & IBRD countries)LatviaLeast developed countries: UN classificationLebanonLesothoLiberiaLibyaLithuaniaLow & middle incomeLow incomeLower middle incomeLuxembourgMacao SAR, ChinaMacedonia, FYRMadagascarMalawiMalaysiaMaldivesMaliMaltaMarshall IslandsMauritaniaMauritiusMexicoMicronesia, Fed. Sts.Middle East & North AfricaMiddle East & North Africa (excluding high income)Middle East & North Africa (IDA & IBRD countries)Middle incomeMoldovaMongoliaMontenegroMoroccoMozambiqueMyanmarNamibiaNepalNetherlandsNew CaledoniaNew ZealandNicaraguaNigerNigeriaNorth AmericaNorthern Mariana IslandsNorwayOECD membersOmanOther small statesPacific island small statesPakistanPalauPanamaPapua New GuineaParaguayPeruPhilippinesPolandPortugalPost-demographic dividendPre-demographic dividendQatarRomaniaRussian FederationRwandaSamoaSao Tome and PrincipeSaudi ArabiaSenegalSerbiaSeychellesSierra LeoneSingaporeSint Maarten (Dutch part)Slovak RepublicSloveniaSmall statesSolomon IslandsSouth AfricaSouth AsiaSouth Asia (IDA & IBRD)SpainSri LankaSt. Kitts and NevisSt. LuciaSt. Martin (French part)St. Vincent and the GrenadinesSub-Saharan Africa Sub-Saharan Africa (excluding high income)Sub-Saharan Africa (IDA & IBRD countries)SudanSurinameSwazilandSwedenSwitzerlandSyrian Arab RepublicTajikistanTanzaniaThailandTimor-LesteTogoTongaTrinidad and TobagoTunisiaTurkeyTurkmenistanTuvaluUgandaUkraineUnited Arab EmiratesUnited KingdomUnited StatesUpper middle incomeUruguayUzbekistanVanuatuVenezuela, RBVietnamWorldYemen, Rep.ZambiaZimbabwe La ligne de temps
Cette échelle de temps montre un graphique de 1961 année à 2016 année Caribbean small states. Les données jusqu'à 1960 année ne sont pas présentés. Quantité d'observations actuelles selon dates: 56.
Source (désignation):
Les indicateurs du développement mondiale
Source (organisation):
World Trade Organization.
Catégories:
Private Sector, Trade
Dernière mise à jour
23 avr. 2017
Les indicateurs de changement de valeurs selon les années
Minimum:
824.04 mln.
1 janv. 1961
Maximum:
29.337 mds
1 janv. 2009
Pour la date d''observation
Valeur
Changement absolu
Le changement par rapport à la valeur précédente
1 janv. 1961
824.04 mln.
+824.04 mln.
0.0%
1 janv. 1962
888.773 mln.
+64.733 mln.
7.86%
1 janv. 1963
900.638 mln.
+11.865 mln.
1.34%
1 janv. 1964
939.013 mln.
+38.375 mln.
4.26%
1 janv. 1965
1.13 mds
+191.246 mln.
20.37%
1 janv. 1966
1.228 mds
+97.558 mln.
8.63%
1 janv. 1967
1.314 mds
+86.656 mln.
7.06%
1 janv. 1968
1.344 mds
+29.98 mln.
2.28%
1 janv. 1969
1.383 mds
+38.798 mln.
2.89%
1 janv. 1970
1.671 mds
+287.678 mln.
20.8%
1 janv. 1971
1.935 mds
+264.428 mln.
15.83%
1 janv. 1972
2.303 mds
+367.522 mln.
18.99%
1 janv. 1973
2.516 mds
+213.235 mln.
9.26%
1 janv. 1974
2.945 mds
+428.783 mln.
17.04%
1 janv. 1975
5.639 mds
+2.694 mds
91.47%
1 janv. 1976
6.397 mds
+758.059 mln.
13.44%
1 janv. 1977
7.188 mds
+791.205 mln.
12.37%
1 janv. 1978
7.531 mds
+342.653 mln.
4.77%
1 janv. 1979
7.366 mds
-165.111 mln.
-2.19%
1 janv. 1980
8.206 mds
+840.89 mln.
11.42%
1 janv. 1981
11.747 mds
+3.541 mds
43.14%
1 janv. 1982
9.855 mds
-1.892 mds
-16.11%
1 janv. 1983
10.453 mds
+598.0 mln.
6.07%
1 janv. 1984
8.706 mds
-1.747 mds
-16.71%
1 janv. 1985
7.165 mds
-1.541 mds
-17.7%
1 janv. 1986
5.661 mds
-1.504 mds
-20.99%
1 janv. 1987
5.444 mds
-217.0 mln.
-3.83%
1 janv. 1988
5.497 mds
+53.0 mln.
0.97%
1 janv. 1989
5.65 mds
+153.0 mln.
2.78%
1 janv. 1990
7.081 mds
+1.431 mds
25.33%
1 janv. 1991
7.468 mds
+387.0 mln.
5.47%
1 janv. 1992
8.137 mds
+669.0 mln.
8.96%
1 janv. 1993
6.664 mds
-1.473 mds
-18.1%
1 janv. 1994
7.502 mds
+838.0 mln.
12.58%
1 janv. 1995
7.335 mds
-167.0 mln.
-2.23%
1 janv. 1996
9.077 mds
+1.742 mds
23.75%
1 janv. 1997
9.9 mds
+823.0 mln.
9.07%
1 janv. 1998
11.692 mds
+1.792 mds
18.1%
1 janv. 1999
11.695 mds
+3.0 mln.
0.03%
1 janv. 2000
11.307 mds
-388.0 mln.
-3.32%
1 janv. 2001
12.995 mds
+1.688 mds
14.93%
1 janv. 2002
12.949 mds
-46.08 mln.
-0.35%
1 janv. 2003
12.922 mds
-26.92 mln.
-0.21%
1 janv. 2004
13.927 mds
+1.005 mds
7.78%
1 janv. 2005
15.691 mds
+1.764 mds
12.66%
1 janv. 2006
18.717 mds
+3.026 mds
19.28%
1 janv. 2007
21.326 mds
+2.609 mds
13.94%
1 janv. 2008
24.548 mds
+3.222 mds
15.11%
1 janv. 2009
29.337 mds
+4.789 mds
19.51%
1 janv. 2010
21.414 mds
-7.922 mds
-27.0%
1 janv. 2011
21.678 mds
+263.953 mln.
1.23%
1 janv. 2012
27.228 mds
+5.549 mds
25.6%
1 janv. 2013
27.68 mds
+451.871 mln.
1.66%
1 janv. 2014
27.304 mds
-375.235 mln.
-1.36%
1 janv. 2015
26.407 mds
-897.126 mln.
-3.29%
1 janv. 2016
22.768 mds
-3.639 mds
-13.78%
Classement des pays selon les statistiques actuelles par années


Commentaires: