29
/fr/
fr
AIzaSyAYiBZKx7MnpbEhh9jyipgxe19OcubqV5w
April 1, 2024
116016
Cuba
CUB
true
2
1
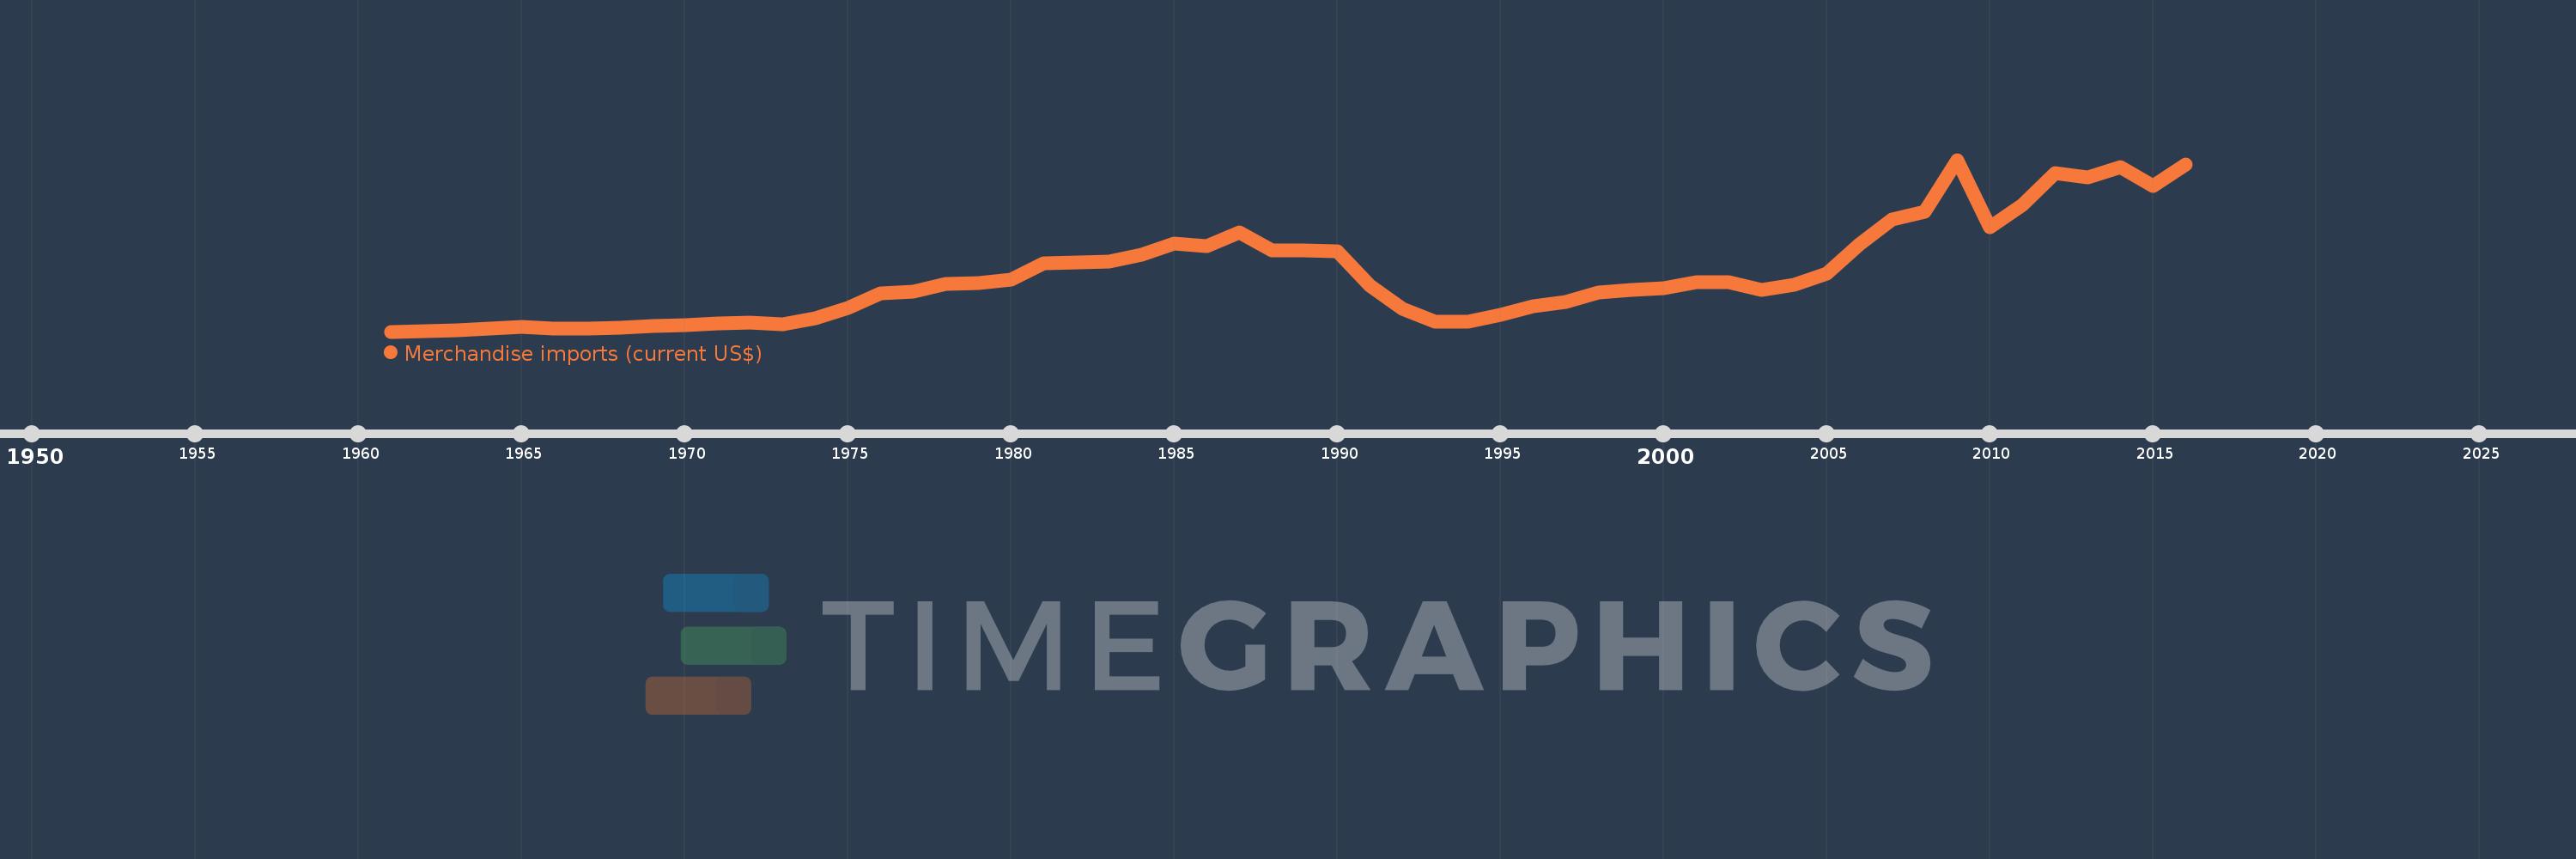
Merchandise imports (current US$)
2016,2015,2014,2013,2012,2011,2010,2009,2008,2007,2006,2005,2004,2003,2002,2001,2000,1999,1998,1997,1996,1995,1994,1993,1992,1991,1990,1989,1988,1987,1986,1985,1984,1983,1982,1981,1980,1979,1978,1977,1976,1975,1974,1973,1972,1971,1970,1969,1968,1967,1966,1965,1964,1963,1962,1961
Cette statistique dans les autres pays:
AfghanistanAlbaniaAlgeriaAmerican SamoaAngolaAntigua and BarbudaArab WorldArgentinaArmeniaArubaAustraliaAustriaAzerbaijanBahamas, TheBahrainBangladeshBarbadosBelarusBelgiumBelizeBeninBermudaBhutanBoliviaBosnia and HerzegovinaBotswanaBrazilBrunei DarussalamBulgariaBurkina FasoBurundiCabo VerdeCambodiaCameroonCanadaCaribbean small statesCentral African RepublicCentral Europe and the BalticsChadChileChinaColombiaComorosCongo, Dem. Rep.Congo, Rep.Costa RicaCote d'IvoireCroatiaCubaCuracaoCyprusCzech RepublicDenmarkDjiboutiDominicaDominican RepublicEarly-demographic dividendEast Asia & PacificEast Asia & Pacific (excluding high income)East Asia & Pacific (IDA & IBRD countries)EcuadorEgypt, Arab Rep.El SalvadorEquatorial GuineaEritreaEstoniaEthiopiaEuro areaEurope & Central AsiaEurope & Central Asia (excluding high income)Europe & Central Asia (IDA & IBRD countries)European UnionFaroe IslandsFijiFinlandFragile and conflict affected situationsFranceFrench PolynesiaGabonGambia, TheGeorgiaGermanyGhanaGreeceGreenlandGrenadaGuatemalaGuineaGuinea-BissauGuyanaHaitiHeavily indebted poor countries (HIPC)High incomeHondurasHong Kong SAR, ChinaHungaryIBRD onlyIcelandIDA & IBRD totalIDA blendIDA onlyIDA totalIndiaIndonesiaIran, Islamic Rep.IraqIrelandIsraelItalyJamaicaJapanJordanKazakhstanKenyaKiribatiKorea, Dem. People’s Rep.Korea, Rep.KuwaitKyrgyz RepublicLao PDRLate-demographic dividendLatin America & Caribbean Latin America & Caribbean (excluding high income)Latin America & the Caribbean (IDA & IBRD countries)LatviaLeast developed countries: UN classificationLebanonLesothoLiberiaLibyaLithuaniaLow & middle incomeLow incomeLower middle incomeLuxembourgMacao SAR, ChinaMacedonia, FYRMadagascarMalawiMalaysiaMaldivesMaliMaltaMarshall IslandsMauritaniaMauritiusMexicoMicronesia, Fed. Sts.Middle East & North AfricaMiddle East & North Africa (excluding high income)Middle East & North Africa (IDA & IBRD countries)Middle incomeMoldovaMongoliaMontenegroMoroccoMozambiqueMyanmarNamibiaNepalNetherlandsNew CaledoniaNew ZealandNicaraguaNigerNigeriaNorth AmericaNorthern Mariana IslandsNorwayOECD membersOmanOther small statesPacific island small statesPakistanPalauPanamaPapua New GuineaParaguayPeruPhilippinesPolandPortugalPost-demographic dividendPre-demographic dividendQatarRomaniaRussian FederationRwandaSamoaSao Tome and PrincipeSaudi ArabiaSenegalSerbiaSeychellesSierra LeoneSingaporeSint Maarten (Dutch part)Slovak RepublicSloveniaSmall statesSolomon IslandsSouth AfricaSouth AsiaSouth Asia (IDA & IBRD)SpainSri LankaSt. Kitts and NevisSt. LuciaSt. Martin (French part)St. Vincent and the GrenadinesSub-Saharan Africa Sub-Saharan Africa (excluding high income)Sub-Saharan Africa (IDA & IBRD countries)SudanSurinameSwazilandSwedenSwitzerlandSyrian Arab RepublicTajikistanTanzaniaThailandTimor-LesteTogoTongaTrinidad and TobagoTunisiaTurkeyTurkmenistanTuvaluUgandaUkraineUnited Arab EmiratesUnited KingdomUnited StatesUpper middle incomeUruguayUzbekistanVanuatuVenezuela, RBVietnamWorldYemen, Rep.ZambiaZimbabwe La ligne de temps
Cette échelle de temps montre un graphique de 1961 année à 2016 année Cuba. Les données jusqu'à 1960 année ne sont pas présentés. Quantité d'observations actuelles selon dates: 56.
Source (désignation):
Les indicateurs du développement mondiale
Source (organisation):
World Trade Organization.
Catégories:
Private Sector, Trade
Dernière mise à jour
23 avr. 2017
Les indicateurs de changement de valeurs selon les années
Minimum:
638.0 mln.
1 janv. 1961
Maximum:
15.373 mds
1 janv. 2009
Pour la date d''observation
Valeur
Changement absolu
Le changement par rapport à la valeur précédente
1 janv. 1961
638.0 mln.
+638.0 mln.
0.0%
1 janv. 1962
703.0 mln.
+65.0 mln.
10.19%
1 janv. 1963
759.0 mln.
+56.0 mln.
7.97%
1 janv. 1964
867.0 mln.
+108.0 mln.
14.23%
1 janv. 1965
1.019 mds
+152.0 mln.
17.53%
1 janv. 1966
866.0 mln.
-153.0 mln.
-15.01%
1 janv. 1967
926.0 mln.
+60.0 mln.
6.93%
1 janv. 1968
999.0 mln.
+73.0 mln.
7.88%
1 janv. 1969
1.102 mds
+103.0 mln.
10.31%
1 janv. 1970
1.222 mds
+120.0 mln.
10.89%
1 janv. 1971
1.311 mds
+89.0 mln.
7.28%
1 janv. 1972
1.387 mds
+76.0 mln.
5.8%
1 janv. 1973
1.292 mds
-95.0 mln.
-6.85%
1 janv. 1974
1.793 mds
+501.0 mln.
38.78%
1 janv. 1975
2.648 mds
+855.0 mln.
47.69%
1 janv. 1976
3.883 mds
+1.235 mds
46.64%
1 janv. 1977
4.066 mds
+183.0 mln.
4.71%
1 janv. 1978
4.7 mds
+634.0 mln.
15.59%
1 janv. 1979
4.78 mds
+80.0 mln.
1.7%
1 janv. 1980
5.085 mds
+305.0 mln.
6.38%
1 janv. 1981
6.505 mds
+1.42 mds
27.93%
1 janv. 1982
6.545 mds
+40.0 mln.
0.61%
1 janv. 1983
6.637 mds
+92.0 mln.
1.41%
1 janv. 1984
7.211 mds
+574.0 mln.
8.65%
1 janv. 1985
8.167 mds
+956.0 mln.
13.26%
1 janv. 1986
7.983 mds
-184.0 mln.
-2.25%
1 janv. 1987
9.173 mds
+1.19 mds
14.91%
1 janv. 1988
7.612 mds
-1.561 mds
-17.02%
1 janv. 1989
7.579 mds
-33.0 mln.
-0.43%
1 janv. 1990
7.526 mds
-53.0 mln.
-0.7%
1 janv. 1991
4.6 mds
-2.926 mds
-38.88%
1 janv. 1992
2.6 mds
-2.0 mds
-43.48%
1 janv. 1993
1.5 mds
-1.1 mds
-42.31%
1 janv. 1994
1.5 mds
0.0
0.0%
1 janv. 1995
2.055 mds
+555.0 mln.
37.0%
1 janv. 1996
2.825 mds
+770.0 mln.
37.47%
1 janv. 1997
3.205 mds
+380.0 mln.
13.45%
1 janv. 1998
3.987 mds
+782.0 mln.
24.4%
1 janv. 1999
4.197 mds
+210.0 mln.
5.27%
1 janv. 2000
4.365 mds
+168.0 mln.
4.0%
1 janv. 2001
4.843 mds
+478.0 mln.
10.95%
1 janv. 2002
4.839 mds
-4.0 mln.
-0.08%
1 janv. 2003
4.176 mds
-663.0 mln.
-13.7%
1 janv. 2004
4.673 mds
+497.2 mln.
11.91%
1 janv. 2005
5.615 mds
+942.0 mln.
20.16%
1 janv. 2006
8.084 mds
+2.469 mds
43.97%
1 janv. 2007
10.258 mds
+2.174 mds
26.89%
1 janv. 2008
10.886 mds
+627.822 mln.
6.12%
1 janv. 2009
15.373 mds
+4.487 mds
41.22%
1 janv. 2010
9.619 mds
-5.755 mds
-37.43%
1 janv. 2011
11.496 mds
+1.877 mds
19.52%
1 janv. 2012
14.243 mds
+2.747 mds
23.89%
1 janv. 2013
13.869 mds
-373.973 mln.
-2.63%
1 janv. 2014
14.773 mds
+903.9 mln.
6.52%
1 janv. 2015
13.114 mds
-1.659 mds
-11.23%
1 janv. 2016
15.0 mds
+1.886 mds
14.38%
Classement des pays selon les statistiques actuelles par années


Commentaires: