29
/fr/
fr
AIzaSyAYiBZKx7MnpbEhh9jyipgxe19OcubqV5w
April 1, 2024
121166
Dominica
DMA
true
2
1
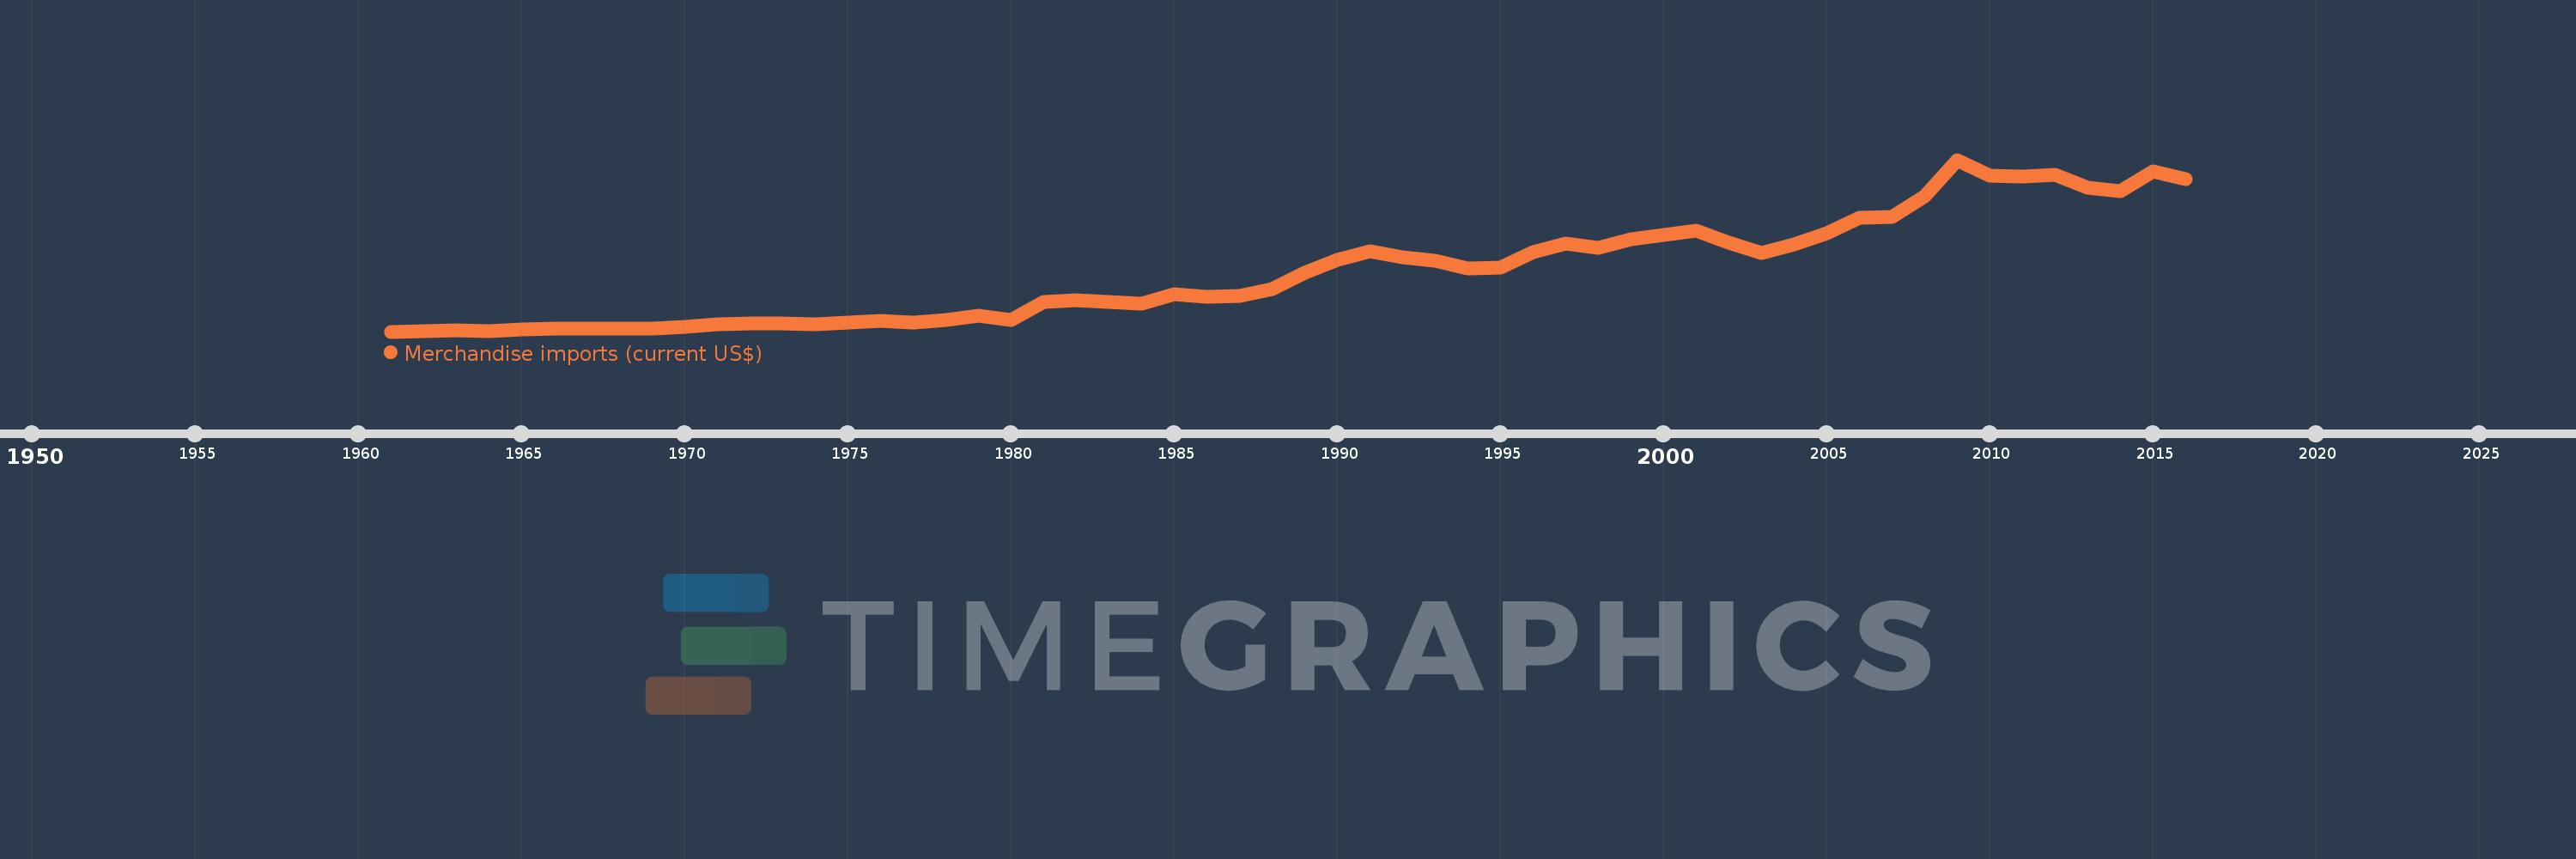
Merchandise imports (current US$)
2016,2015,2014,2013,2012,2011,2010,2009,2008,2007,2006,2005,2004,2003,2002,2001,2000,1999,1998,1997,1996,1995,1994,1993,1992,1991,1990,1989,1988,1987,1986,1985,1984,1983,1982,1981,1980,1979,1978,1977,1976,1975,1974,1973,1972,1971,1970,1969,1968,1967,1966,1965,1964,1963,1962,1961
Cette statistique dans les autres pays:
AfghanistanAlbaniaAlgeriaAmerican SamoaAngolaAntigua and BarbudaArab WorldArgentinaArmeniaArubaAustraliaAustriaAzerbaijanBahamas, TheBahrainBangladeshBarbadosBelarusBelgiumBelizeBeninBermudaBhutanBoliviaBosnia and HerzegovinaBotswanaBrazilBrunei DarussalamBulgariaBurkina FasoBurundiCabo VerdeCambodiaCameroonCanadaCaribbean small statesCentral African RepublicCentral Europe and the BalticsChadChileChinaColombiaComorosCongo, Dem. Rep.Congo, Rep.Costa RicaCote d'IvoireCroatiaCubaCuracaoCyprusCzech RepublicDenmarkDjiboutiDominicaDominican RepublicEarly-demographic dividendEast Asia & PacificEast Asia & Pacific (excluding high income)East Asia & Pacific (IDA & IBRD countries)EcuadorEgypt, Arab Rep.El SalvadorEquatorial GuineaEritreaEstoniaEthiopiaEuro areaEurope & Central AsiaEurope & Central Asia (excluding high income)Europe & Central Asia (IDA & IBRD countries)European UnionFaroe IslandsFijiFinlandFragile and conflict affected situationsFranceFrench PolynesiaGabonGambia, TheGeorgiaGermanyGhanaGreeceGreenlandGrenadaGuatemalaGuineaGuinea-BissauGuyanaHaitiHeavily indebted poor countries (HIPC)High incomeHondurasHong Kong SAR, ChinaHungaryIBRD onlyIcelandIDA & IBRD totalIDA blendIDA onlyIDA totalIndiaIndonesiaIran, Islamic Rep.IraqIrelandIsraelItalyJamaicaJapanJordanKazakhstanKenyaKiribatiKorea, Dem. People’s Rep.Korea, Rep.KuwaitKyrgyz RepublicLao PDRLate-demographic dividendLatin America & Caribbean Latin America & Caribbean (excluding high income)Latin America & the Caribbean (IDA & IBRD countries)LatviaLeast developed countries: UN classificationLebanonLesothoLiberiaLibyaLithuaniaLow & middle incomeLow incomeLower middle incomeLuxembourgMacao SAR, ChinaMacedonia, FYRMadagascarMalawiMalaysiaMaldivesMaliMaltaMarshall IslandsMauritaniaMauritiusMexicoMicronesia, Fed. Sts.Middle East & North AfricaMiddle East & North Africa (excluding high income)Middle East & North Africa (IDA & IBRD countries)Middle incomeMoldovaMongoliaMontenegroMoroccoMozambiqueMyanmarNamibiaNepalNetherlandsNew CaledoniaNew ZealandNicaraguaNigerNigeriaNorth AmericaNorthern Mariana IslandsNorwayOECD membersOmanOther small statesPacific island small statesPakistanPalauPanamaPapua New GuineaParaguayPeruPhilippinesPolandPortugalPost-demographic dividendPre-demographic dividendQatarRomaniaRussian FederationRwandaSamoaSao Tome and PrincipeSaudi ArabiaSenegalSerbiaSeychellesSierra LeoneSingaporeSint Maarten (Dutch part)Slovak RepublicSloveniaSmall statesSolomon IslandsSouth AfricaSouth AsiaSouth Asia (IDA & IBRD)SpainSri LankaSt. Kitts and NevisSt. LuciaSt. Martin (French part)St. Vincent and the GrenadinesSub-Saharan Africa Sub-Saharan Africa (excluding high income)Sub-Saharan Africa (IDA & IBRD countries)SudanSurinameSwazilandSwedenSwitzerlandSyrian Arab RepublicTajikistanTanzaniaThailandTimor-LesteTogoTongaTrinidad and TobagoTunisiaTurkeyTurkmenistanTuvaluUgandaUkraineUnited Arab EmiratesUnited KingdomUnited StatesUpper middle incomeUruguayUzbekistanVanuatuVenezuela, RBVietnamWorldYemen, Rep.ZambiaZimbabwe La ligne de temps
Cette échelle de temps montre un graphique de 1961 année à 2016 année Dominica. Les données jusqu'à 1960 année ne sont pas présentés. Quantité d'observations actuelles selon dates: 56.
Source (désignation):
Les indicateurs du développement mondiale
Source (organisation):
World Trade Organization.
Catégories:
Private Sector, Trade
Dernière mise à jour
23 avr. 2017
Les indicateurs de changement de valeurs selon les années
Minimum:
5.812 mln.
1 janv. 1961
Maximum:
247.019 mln.
1 janv. 2009
Pour la date d''observation
Valeur
Changement absolu
Le changement par rapport à la valeur précédente
1 janv. 1961
5.812 mln.
+5.812 mln.
0.0%
1 janv. 1962
6.17 mln.
+357.58 milles
6.15%
1 janv. 1963
7.413 mln.
+1.243 mln.
20.15%
1 janv. 1964
6.956 mln.
-457.33 milles
-6.17%
1 janv. 1965
8.728 mln.
+1.772 mln.
25.48%
1 janv. 1966
10.029 mln.
+1.301 mln.
14.9%
1 janv. 1967
9.885 mln.
-144.04 milles
-1.44%
1 janv. 1968
9.785 mln.
-99.71 milles
-1.01%
1 janv. 1969
10.049 mln.
+263.65 milles
2.69%
1 janv. 1970
12.357 mln.
+2.308 mln.
22.97%
1 janv. 1971
15.757 mln.
+3.401 mln.
27.52%
1 janv. 1972
16.72 mln.
+962.6 milles
6.11%
1 janv. 1973
17.114 mln.
+394.0 milles
2.36%
1 janv. 1974
16.483 mln.
-631.0 milles
-3.69%
1 janv. 1975
18.954 mln.
+2.472 mln.
15.0%
1 janv. 1976
20.756 mln.
+1.801 mln.
9.5%
1 janv. 1977
19.059 mln.
-1.697 mln.
-8.18%
1 janv. 1978
21.882 mln.
+2.823 mln.
14.81%
1 janv. 1979
28.433 mln.
+6.551 mln.
29.94%
1 janv. 1980
22.211 mln.
-6.222 mln.
-21.88%
1 janv. 1981
48.0 mln.
+25.789 mln.
116.11%
1 janv. 1982
50.0 mln.
+2.0 mln.
4.17%
1 janv. 1983
48.0 mln.
-2.0 mln.
-4.0%
1 janv. 1984
45.0 mln.
-3.0 mln.
-6.25%
1 janv. 1985
58.0 mln.
+13.0 mln.
28.89%
1 janv. 1986
55.0 mln.
-3.0 mln.
-5.17%
1 janv. 1987
56.0 mln.
+1000.0 milles
1.82%
1 janv. 1988
66.0 mln.
+10.0 mln.
17.86%
1 janv. 1989
88.0 mln.
+22.0 mln.
33.33%
1 janv. 1990
107.0 mln.
+19.0 mln.
21.59%
1 janv. 1991
118.0 mln.
+11.0 mln.
10.28%
1 janv. 1992
110.0 mln.
-8.0 mln.
-6.78%
1 janv. 1993
105.0 mln.
-5.0 mln.
-4.55%
1 janv. 1994
94.0 mln.
-11.0 mln.
-10.48%
1 janv. 1995
96.0 mln.
+2.0 mln.
2.13%
1 janv. 1996
117.0 mln.
+21.0 mln.
21.88%
1 janv. 1997
129.0 mln.
+12.0 mln.
10.26%
1 janv. 1998
124.0 mln.
-5.0 mln.
-3.88%
1 janv. 1999
136.0 mln.
+12.0 mln.
9.68%
1 janv. 2000
141.0 mln.
+5.0 mln.
3.68%
1 janv. 2001
148.0 mln.
+7.0 mln.
4.96%
1 janv. 2002
131.0 mln.
-17.0 mln.
-11.49%
1 janv. 2003
116.0 mln.
-15.0 mln.
-11.45%
1 janv. 2004
127.948 mln.
+11.948 mln.
10.3%
1 janv. 2005
144.411 mln.
+16.463 mln.
12.87%
1 janv. 2006
165.342 mln.
+20.931 mln.
14.49%
1 janv. 2007
166.896 mln.
+1.554 mln.
0.94%
1 janv. 2008
195.734 mln.
+28.838 mln.
17.28%
1 janv. 2009
247.019 mln.
+51.285 mln.
26.2%
1 janv. 2010
225.256 mln.
-21.763 mln.
-8.81%
1 janv. 2011
223.775 mln.
-1.481 mln.
-0.66%
1 janv. 2012
226.064 mln.
+2.289 mln.
1.02%
1 janv. 2013
208.314 mln.
-17.75 mln.
-7.85%
1 janv. 2014
202.995 mln.
-5.319 mln.
-2.55%
1 janv. 2015
230.28 mln.
+27.285 mln.
13.44%
1 janv. 2016
220.0 mln.
-10.28 mln.
-4.46%
Classement des pays selon les statistiques actuelles par années


Commentaires: