29
/fr/
fr
AIzaSyAYiBZKx7MnpbEhh9jyipgxe19OcubqV5w
April 1, 2024
148209
Guyana
GUY
true
2
1
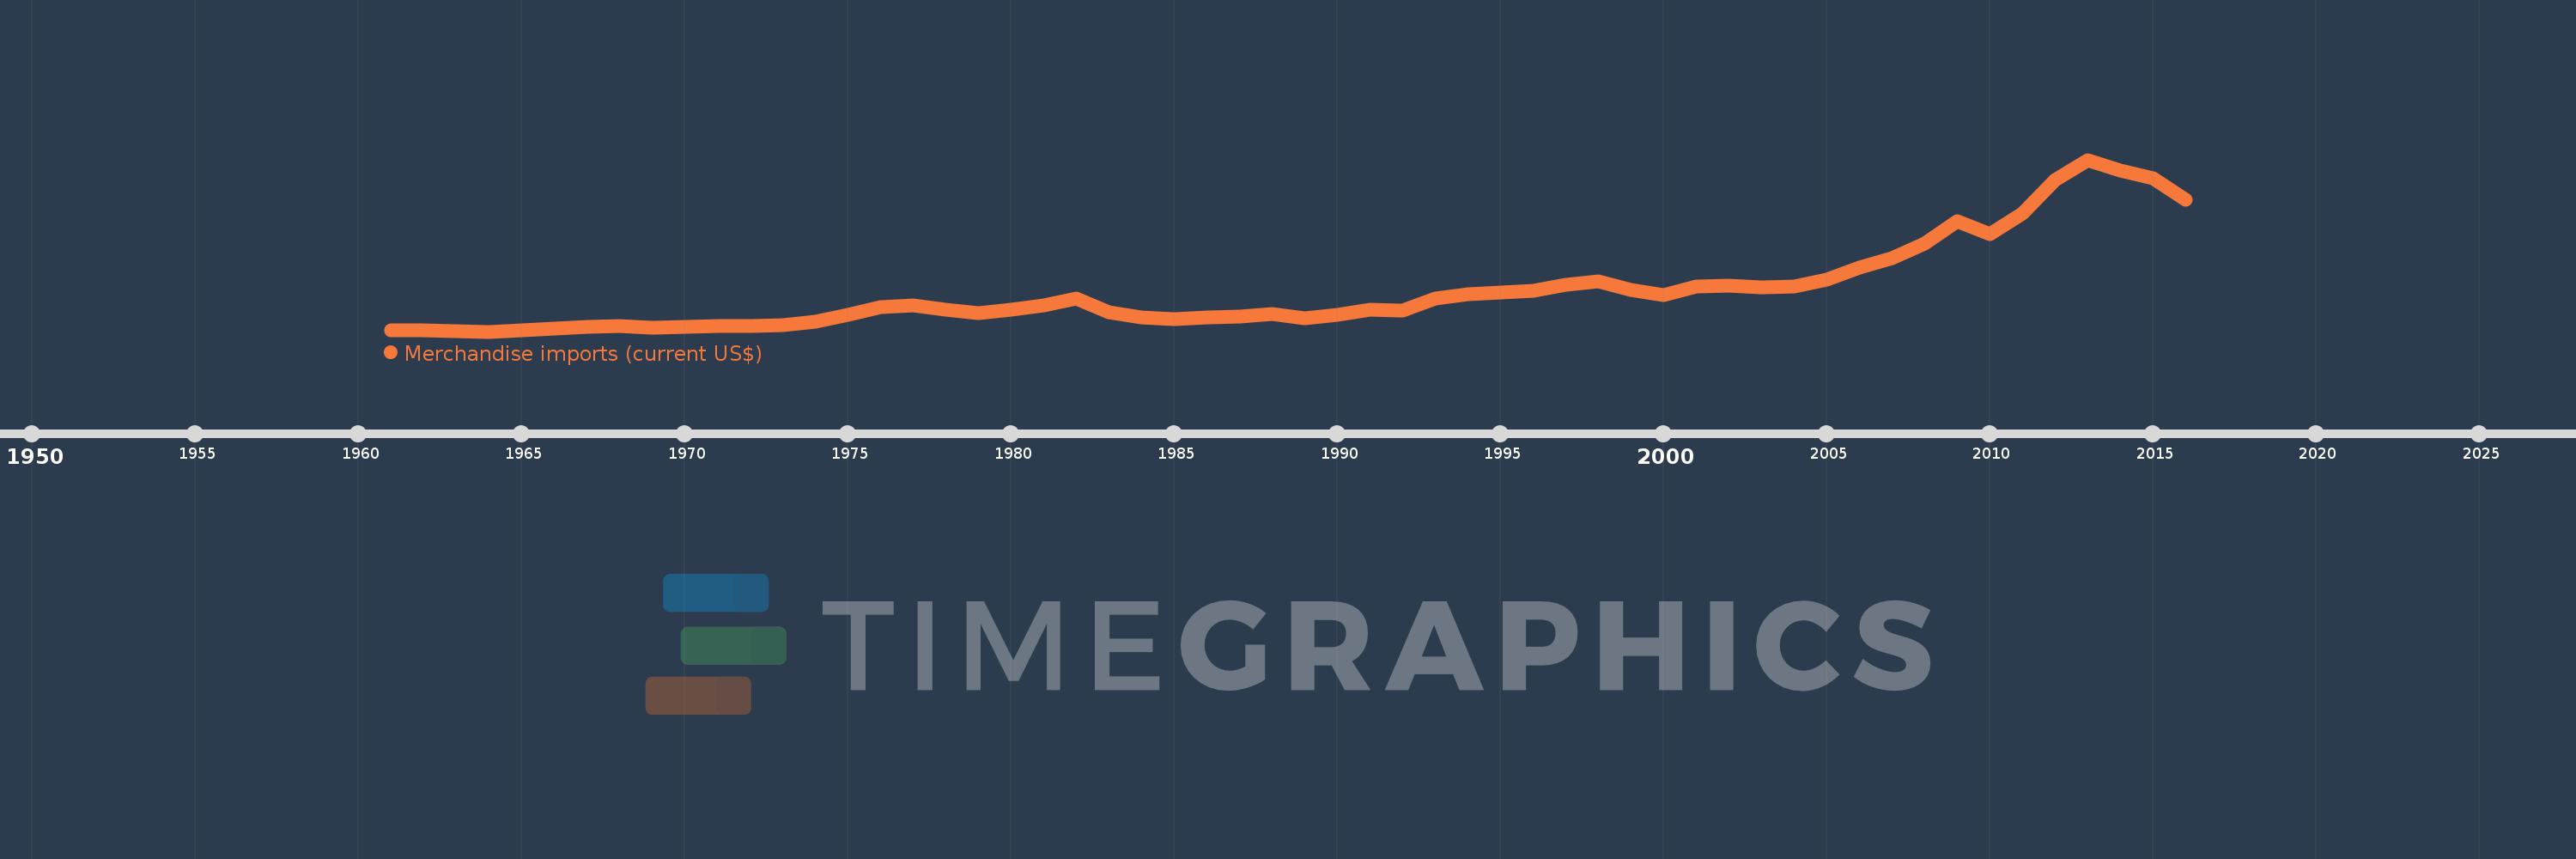
Merchandise imports (current US$)
2016,2015,2014,2013,2012,2011,2010,2009,2008,2007,2006,2005,2004,2003,2002,2001,2000,1999,1998,1997,1996,1995,1994,1993,1992,1991,1990,1989,1988,1987,1986,1985,1984,1983,1982,1981,1980,1979,1978,1977,1976,1975,1974,1973,1972,1971,1970,1969,1968,1967,1966,1965,1964,1963,1962,1961
Cette statistique dans les autres pays:
AfghanistanAlbaniaAlgeriaAmerican SamoaAngolaAntigua and BarbudaArab WorldArgentinaArmeniaArubaAustraliaAustriaAzerbaijanBahamas, TheBahrainBangladeshBarbadosBelarusBelgiumBelizeBeninBermudaBhutanBoliviaBosnia and HerzegovinaBotswanaBrazilBrunei DarussalamBulgariaBurkina FasoBurundiCabo VerdeCambodiaCameroonCanadaCaribbean small statesCentral African RepublicCentral Europe and the BalticsChadChileChinaColombiaComorosCongo, Dem. Rep.Congo, Rep.Costa RicaCote d'IvoireCroatiaCubaCuracaoCyprusCzech RepublicDenmarkDjiboutiDominicaDominican RepublicEarly-demographic dividendEast Asia & PacificEast Asia & Pacific (excluding high income)East Asia & Pacific (IDA & IBRD countries)EcuadorEgypt, Arab Rep.El SalvadorEquatorial GuineaEritreaEstoniaEthiopiaEuro areaEurope & Central AsiaEurope & Central Asia (excluding high income)Europe & Central Asia (IDA & IBRD countries)European UnionFaroe IslandsFijiFinlandFragile and conflict affected situationsFranceFrench PolynesiaGabonGambia, TheGeorgiaGermanyGhanaGreeceGreenlandGrenadaGuatemalaGuineaGuinea-BissauGuyanaHaitiHeavily indebted poor countries (HIPC)High incomeHondurasHong Kong SAR, ChinaHungaryIBRD onlyIcelandIDA & IBRD totalIDA blendIDA onlyIDA totalIndiaIndonesiaIran, Islamic Rep.IraqIrelandIsraelItalyJamaicaJapanJordanKazakhstanKenyaKiribatiKorea, Dem. People’s Rep.Korea, Rep.KuwaitKyrgyz RepublicLao PDRLate-demographic dividendLatin America & Caribbean Latin America & Caribbean (excluding high income)Latin America & the Caribbean (IDA & IBRD countries)LatviaLeast developed countries: UN classificationLebanonLesothoLiberiaLibyaLithuaniaLow & middle incomeLow incomeLower middle incomeLuxembourgMacao SAR, ChinaMacedonia, FYRMadagascarMalawiMalaysiaMaldivesMaliMaltaMarshall IslandsMauritaniaMauritiusMexicoMicronesia, Fed. Sts.Middle East & North AfricaMiddle East & North Africa (excluding high income)Middle East & North Africa (IDA & IBRD countries)Middle incomeMoldovaMongoliaMontenegroMoroccoMozambiqueMyanmarNamibiaNepalNetherlandsNew CaledoniaNew ZealandNicaraguaNigerNigeriaNorth AmericaNorthern Mariana IslandsNorwayOECD membersOmanOther small statesPacific island small statesPakistanPalauPanamaPapua New GuineaParaguayPeruPhilippinesPolandPortugalPost-demographic dividendPre-demographic dividendQatarRomaniaRussian FederationRwandaSamoaSao Tome and PrincipeSaudi ArabiaSenegalSerbiaSeychellesSierra LeoneSingaporeSint Maarten (Dutch part)Slovak RepublicSloveniaSmall statesSolomon IslandsSouth AfricaSouth AsiaSouth Asia (IDA & IBRD)SpainSri LankaSt. Kitts and NevisSt. LuciaSt. Martin (French part)St. Vincent and the GrenadinesSub-Saharan Africa Sub-Saharan Africa (excluding high income)Sub-Saharan Africa (IDA & IBRD countries)SudanSurinameSwazilandSwedenSwitzerlandSyrian Arab RepublicTajikistanTanzaniaThailandTimor-LesteTogoTongaTrinidad and TobagoTunisiaTurkeyTurkmenistanTuvaluUgandaUkraineUnited Arab EmiratesUnited KingdomUnited StatesUpper middle incomeUruguayUzbekistanVanuatuVenezuela, RBVietnamWorldYemen, Rep.ZambiaZimbabwe La ligne de temps
Cette échelle de temps montre un graphique de 1961 année à 2016 année Guyana. Les données jusqu'à 1960 année ne sont pas présentés. Quantité d'observations actuelles selon dates: 56.
Source (désignation):
Les indicateurs du développement mondiale
Source (organisation):
World Trade Organization.
Catégories:
Private Sector, Trade
Dernière mise à jour
23 avr. 2017
Les indicateurs de changement de valeurs selon les années
Minimum:
69.131 mln.
1 janv. 1964
Maximum:
1.997 mds
1 janv. 2013
Pour la date d''observation
Valeur
Changement absolu
Le changement par rapport à la valeur précédente
1 janv. 1961
86.1 mln.
+86.1 mln.
0.0%
1 janv. 1962
85.75 mln.
-350.0 milles
-0.41%
1 janv. 1963
73.663 mln.
-12.087 mln.
-14.1%
1 janv. 1964
69.131 mln.
-4.532 mln.
-6.15%
1 janv. 1965
87.371 mln.
+18.241 mln.
26.39%
1 janv. 1966
104.317 mln.
+16.946 mln.
19.39%
1 janv. 1967
117.839 mln.
+13.522 mln.
12.96%
1 janv. 1968
129.556 mln.
+11.717 mln.
9.94%
1 janv. 1969
109.655 mln.
-19.901 mln.
-15.36%
1 janv. 1970
117.915 mln.
+8.26 mln.
7.53%
1 janv. 1971
134.12 mln.
+16.205 mln.
13.74%
1 janv. 1972
134.525 mln.
+405.0 milles
0.3%
1 janv. 1973
142.743 mln.
+8.218 mln.
6.11%
1 janv. 1974
177.026 mln.
+34.283 mln.
24.02%
1 janv. 1975
255.003 mln.
+77.977 mln.
44.05%
1 janv. 1976
343.928 mln.
+88.925 mln.
34.87%
1 janv. 1977
363.686 mln.
+19.758 mln.
5.74%
1 janv. 1978
313.843 mln.
-49.843 mln.
-13.7%
1 janv. 1979
278.863 mln.
-34.98 mln.
-11.15%
1 janv. 1980
317.569 mln.
+38.706 mln.
13.88%
1 janv. 1981
365.0 mln.
+47.431 mln.
14.94%
1 janv. 1982
438.0 mln.
+73.0 mln.
20.0%
1 janv. 1983
283.0 mln.
-155.0 mln.
-35.39%
1 janv. 1984
231.0 mln.
-52.0 mln.
-18.37%
1 janv. 1985
213.0 mln.
-18.0 mln.
-7.79%
1 janv. 1986
226.0 mln.
+13.0 mln.
6.1%
1 janv. 1987
241.0 mln.
+15.0 mln.
6.64%
1 janv. 1988
265.0 mln.
+24.0 mln.
9.96%
1 janv. 1989
216.0 mln.
-49.0 mln.
-18.49%
1 janv. 1990
258.0 mln.
+42.0 mln.
19.44%
1 janv. 1991
311.0 mln.
+53.0 mln.
20.54%
1 janv. 1992
307.0 mln.
-4.0 mln.
-1.29%
1 janv. 1993
442.0 mln.
+135.0 mln.
43.97%
1 janv. 1994
484.0 mln.
+42.0 mln.
9.5%
1 janv. 1995
506.0 mln.
+22.0 mln.
4.55%
1 janv. 1996
527.0 mln.
+21.0 mln.
4.15%
1 janv. 1997
597.0 mln.
+70.0 mln.
13.28%
1 janv. 1998
630.0 mln.
+33.0 mln.
5.53%
1 janv. 1999
540.0 mln.
-90.0 mln.
-14.29%
1 janv. 2000
480.0 mln.
-60.0 mln.
-11.11%
1 janv. 2001
573.0 mln.
+93.0 mln.
19.38%
1 janv. 2002
584.0 mln.
+11.0 mln.
1.92%
1 janv. 2003
563.0 mln.
-21.0 mln.
-3.6%
1 janv. 2004
576.105 mln.
+13.105 mln.
2.33%
1 janv. 2005
651.296 mln.
+75.191 mln.
13.05%
1 janv. 2006
788.285 mln.
+136.989 mln.
21.03%
1 janv. 2007
889.427 mln.
+101.142 mln.
12.83%
1 janv. 2008
1.059 mds
+169.993 mln.
19.11%
1 janv. 2009
1.312 mds
+252.81 mln.
23.86%
1 janv. 2010
1.161 mds
-151.56 mln.
-11.55%
1 janv. 2011
1.397 mds
+236.43 mln.
20.37%
1 janv. 2012
1.77 mds
+373.4 mln.
26.73%
1 janv. 2013
1.997 mds
+226.2 mln.
12.78%
1 janv. 2014
1.875 mds
-121.8 mln.
-6.1%
1 janv. 2015
1.791 mds
-83.6 mln.
-4.46%
1 janv. 2016
1.55 mds
-241.3 mln.
-13.47%
Classement des pays selon les statistiques actuelles par années


Commentaires: