29
/fr/
fr
AIzaSyAYiBZKx7MnpbEhh9jyipgxe19OcubqV5w
April 1, 2024
132255
Fiji
FJI
true
2
1
Merchandise imports (current US$)
2016,2015,2014,2013,2012,2011,2010,2009,2008,2007,2006,2005,2004,2003,2002,2001,2000,1999,1998,1997,1996,1995,1994,1993,1992,1991,1990,1989,1988,1987,1986,1985,1984,1983,1982,1981,1980,1979,1978,1977,1976,1975,1974,1973,1972,1971,1970,1969,1968,1967,1966,1965,1964,1963,1962,1961
Cette statistique dans les autres pays:
AfghanistanAlbaniaAlgeriaAmerican SamoaAngolaAntigua and BarbudaArab WorldArgentinaArmeniaArubaAustraliaAustriaAzerbaijanBahamas, TheBahrainBangladeshBarbadosBelarusBelgiumBelizeBeninBermudaBhutanBoliviaBosnia and HerzegovinaBotswanaBrazilBrunei DarussalamBulgariaBurkina FasoBurundiCabo VerdeCambodiaCameroonCanadaCaribbean small statesCentral African RepublicCentral Europe and the BalticsChadChileChinaColombiaComorosCongo, Dem. Rep.Congo, Rep.Costa RicaCote d'IvoireCroatiaCubaCuracaoCyprusCzech RepublicDenmarkDjiboutiDominicaDominican RepublicEarly-demographic dividendEast Asia & PacificEast Asia & Pacific (excluding high income)East Asia & Pacific (IDA & IBRD countries)EcuadorEgypt, Arab Rep.El SalvadorEquatorial GuineaEritreaEstoniaEthiopiaEuro areaEurope & Central AsiaEurope & Central Asia (excluding high income)Europe & Central Asia (IDA & IBRD countries)European UnionFaroe IslandsFijiFinlandFragile and conflict affected situationsFranceFrench PolynesiaGabonGambia, TheGeorgiaGermanyGhanaGreeceGreenlandGrenadaGuatemalaGuineaGuinea-BissauGuyanaHaitiHeavily indebted poor countries (HIPC)High incomeHondurasHong Kong SAR, ChinaHungaryIBRD onlyIcelandIDA & IBRD totalIDA blendIDA onlyIDA totalIndiaIndonesiaIran, Islamic Rep.IraqIrelandIsraelItalyJamaicaJapanJordanKazakhstanKenyaKiribatiKorea, Dem. People’s Rep.Korea, Rep.KuwaitKyrgyz RepublicLao PDRLate-demographic dividendLatin America & Caribbean Latin America & Caribbean (excluding high income)Latin America & the Caribbean (IDA & IBRD countries)LatviaLeast developed countries: UN classificationLebanonLesothoLiberiaLibyaLithuaniaLow & middle incomeLow incomeLower middle incomeLuxembourgMacao SAR, ChinaMacedonia, FYRMadagascarMalawiMalaysiaMaldivesMaliMaltaMarshall IslandsMauritaniaMauritiusMexicoMicronesia, Fed. Sts.Middle East & North AfricaMiddle East & North Africa (excluding high income)Middle East & North Africa (IDA & IBRD countries)Middle incomeMoldovaMongoliaMontenegroMoroccoMozambiqueMyanmarNamibiaNepalNetherlandsNew CaledoniaNew ZealandNicaraguaNigerNigeriaNorth AmericaNorthern Mariana IslandsNorwayOECD membersOmanOther small statesPacific island small statesPakistanPalauPanamaPapua New GuineaParaguayPeruPhilippinesPolandPortugalPost-demographic dividendPre-demographic dividendQatarRomaniaRussian FederationRwandaSamoaSao Tome and PrincipeSaudi ArabiaSenegalSerbiaSeychellesSierra LeoneSingaporeSint Maarten (Dutch part)Slovak RepublicSloveniaSmall statesSolomon IslandsSouth AfricaSouth AsiaSouth Asia (IDA & IBRD)SpainSri LankaSt. Kitts and NevisSt. LuciaSt. Martin (French part)St. Vincent and the GrenadinesSub-Saharan Africa Sub-Saharan Africa (excluding high income)Sub-Saharan Africa (IDA & IBRD countries)SudanSurinameSwazilandSwedenSwitzerlandSyrian Arab RepublicTajikistanTanzaniaThailandTimor-LesteTogoTongaTrinidad and TobagoTunisiaTurkeyTurkmenistanTuvaluUgandaUkraineUnited Arab EmiratesUnited KingdomUnited StatesUpper middle incomeUruguayUzbekistanVanuatuVenezuela, RBVietnamWorldYemen, Rep.ZambiaZimbabwe La ligne de temps
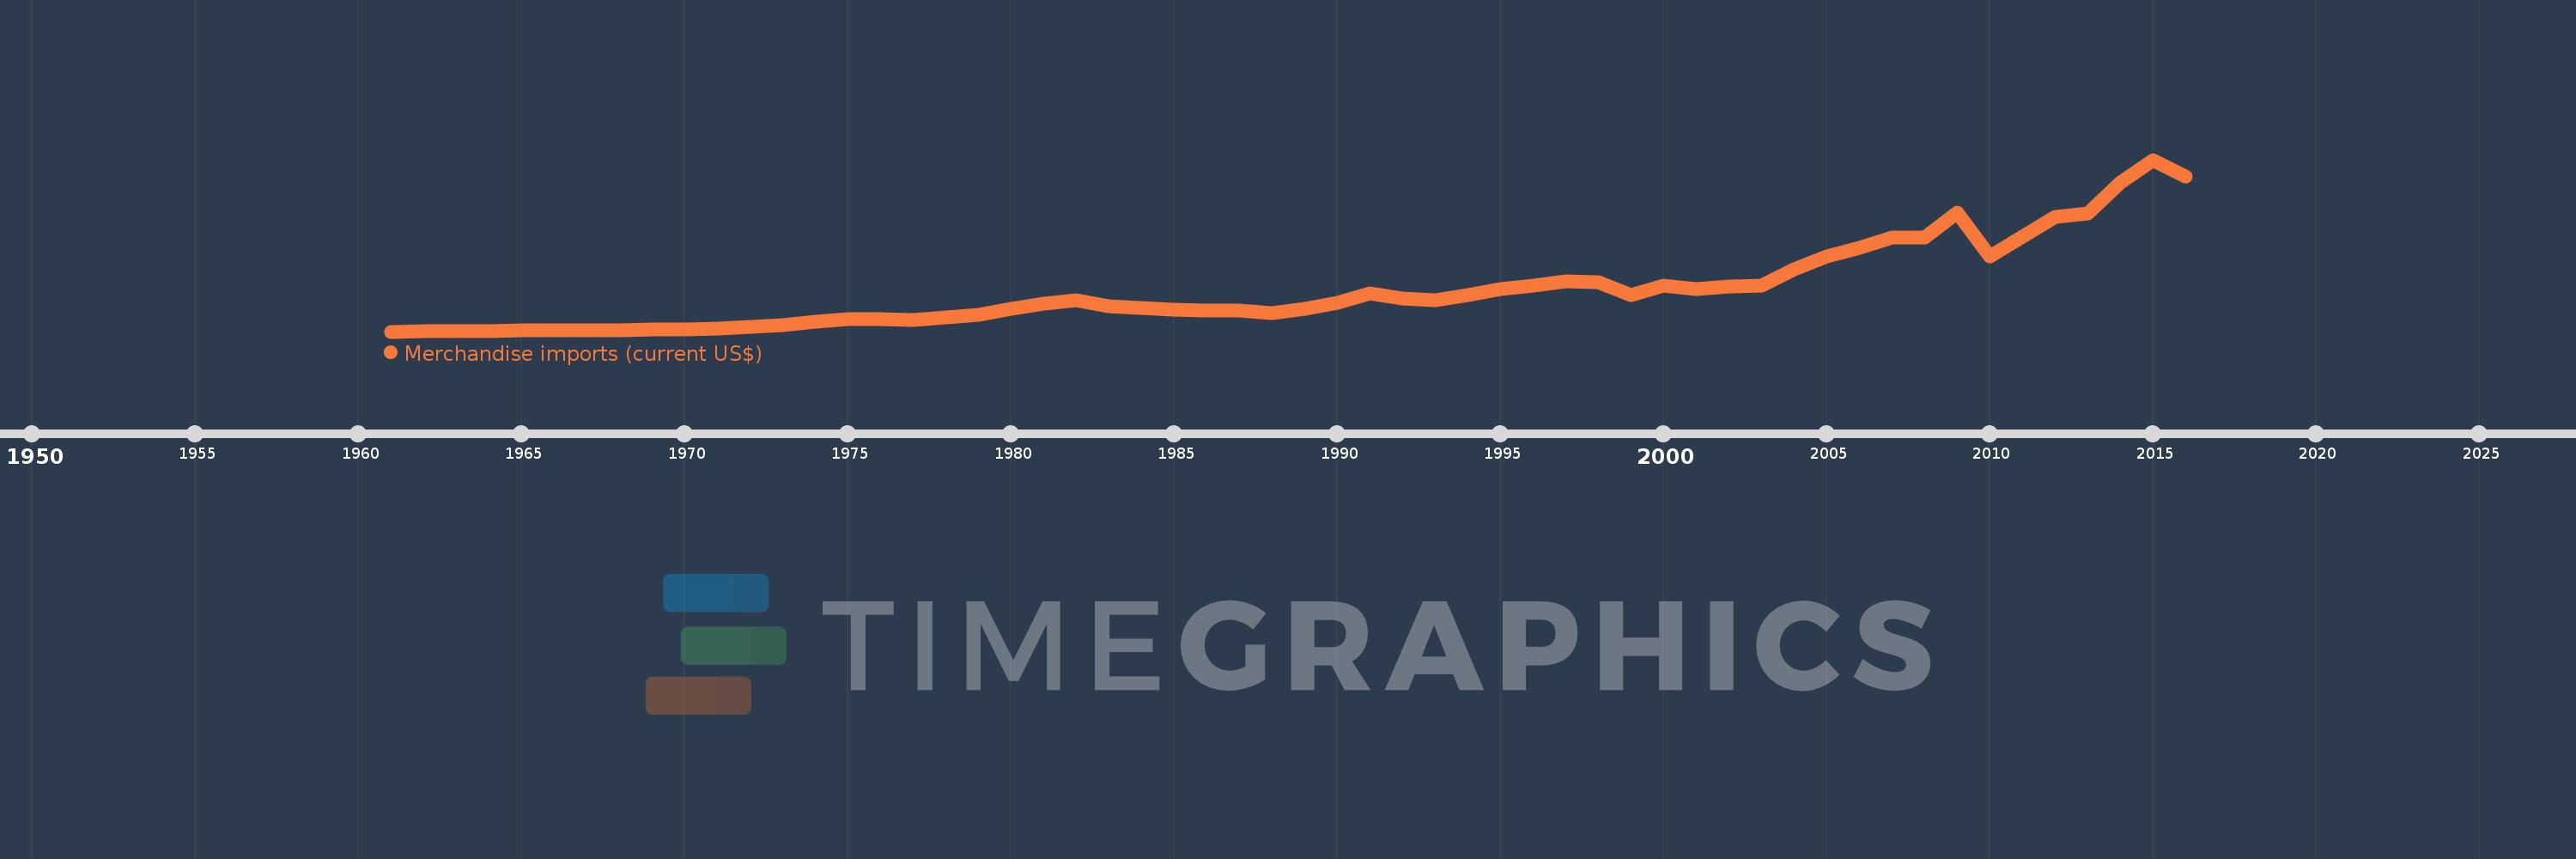
Cette échelle de temps montre un graphique de 1961 année à 2016 année Fiji. Les données jusqu'à 1960 année ne sont pas présentés. Quantité d'observations actuelles selon dates: 56.
Source (désignation):
Les indicateurs du développement mondiale
Source (organisation):
World Trade Organization.
Catégories:
Private Sector, Trade
Dernière mise à jour
23 avr. 2017
Les indicateurs de changement de valeurs selon les années
Minimum:
41.382 mln.
1 janv. 1961
Maximum:
3.25 mds
1 janv. 2015
Pour la date d''observation
Valeur
Changement absolu
Le changement par rapport à la valeur précédente
1 janv. 1961
41.382 mln.
+41.382 mln.
0.0%
1 janv. 1962
43.463 mln.
+2.081 mln.
5.03%
1 janv. 1963
43.854 mln.
+391.0 milles
0.9%
1 janv. 1964
50.968 mln.
+7.114 mln.
16.22%
1 janv. 1965
69.685 mln.
+18.717 mln.
36.72%
1 janv. 1966
73.355 mln.
+3.67 mln.
5.27%
1 janv. 1967
63.744 mln.
-9.611 mln.
-13.1%
1 janv. 1968
71.248 mln.
+7.504 mln.
11.77%
1 janv. 1969
78.534 mln.
+7.286 mln.
10.23%
1 janv. 1970
89.007 mln.
+10.473 mln.
13.34%
1 janv. 1971
103.946 mln.
+14.939 mln.
16.78%
1 janv. 1972
129.36 mln.
+25.414 mln.
24.45%
1 janv. 1973
159.438 mln.
+30.078 mln.
23.25%
1 janv. 1974
222.211 mln.
+62.773 mln.
39.37%
1 janv. 1975
272.631 mln.
+50.42 mln.
22.69%
1 janv. 1976
268.206 mln.
-4.425 mln.
-1.62%
1 janv. 1977
264.007 mln.
-4.199 mln.
-1.57%
1 janv. 1978
306.684 mln.
+42.677 mln.
16.17%
1 janv. 1979
355.164 mln.
+48.48 mln.
15.81%
1 janv. 1980
469.792 mln.
+114.628 mln.
32.27%
1 janv. 1981
562.0 mln.
+92.208 mln.
19.63%
1 janv. 1982
631.0 mln.
+69.0 mln.
12.28%
1 janv. 1983
509.0 mln.
-122.0 mln.
-19.33%
1 janv. 1984
484.0 mln.
-25.0 mln.
-4.91%
1 janv. 1985
450.0 mln.
-34.0 mln.
-7.02%
1 janv. 1986
442.0 mln.
-8.0 mln.
-1.78%
1 janv. 1987
435.0 mln.
-7.0 mln.
-1.58%
1 janv. 1988
379.0 mln.
-56.0 mln.
-12.87%
1 janv. 1989
462.0 mln.
+83.0 mln.
21.9%
1 janv. 1990
581.0 mln.
+119.0 mln.
25.76%
1 janv. 1991
754.0 mln.
+173.0 mln.
29.78%
1 janv. 1992
652.0 mln.
-102.0 mln.
-13.53%
1 janv. 1993
630.0 mln.
-22.0 mln.
-3.37%
1 janv. 1994
720.0 mln.
+90.0 mln.
14.29%
1 janv. 1995
842.0 mln.
+122.0 mln.
16.94%
1 janv. 1996
892.0 mln.
+50.0 mln.
5.94%
1 janv. 1997
987.0 mln.
+95.0 mln.
10.65%
1 janv. 1998
965.0 mln.
-22.0 mln.
-2.23%
1 janv. 1999
722.0 mln.
-243.0 mln.
-25.18%
1 janv. 2000
903.0 mln.
+181.0 mln.
25.07%
1 janv. 2001
830.0 mln.
-73.0 mln.
-8.08%
1 janv. 2002
886.0 mln.
+56.0 mln.
6.75%
1 janv. 2003
901.0 mln.
+15.0 mln.
1.69%
1 janv. 2004
1.205 mds
+304.0 mln.
33.74%
1 janv. 2005
1.446 mds
+241.0 mln.
20.0%
1 janv. 2006
1.607 mds
+161.0 mln.
11.13%
1 janv. 2007
1.804 mds
+197.234 mln.
12.27%
1 janv. 2008
1.8 mds
-3.764 mln.
-0.21%
1 janv. 2009
2.264 mds
+463.41 mln.
25.74%
1 janv. 2010
1.44 mds
-824.117 mln.
-36.4%
1 janv. 2011
1.808 mds
+368.696 mln.
25.61%
1 janv. 2012
2.182 mds
+373.413 mln.
20.65%
1 janv. 2013
2.253 mds
+70.726 mln.
3.24%
1 janv. 2014
2.826 mds
+573.132 mln.
25.44%
1 janv. 2015
3.25 mds
+424.734 mln.
15.03%
1 janv. 2016
2.94 mds
-310.464 mln.
-9.55%
Classement des pays selon les statistiques actuelles par années


Commentaires: