29
/fr/
fr
AIzaSyAYiBZKx7MnpbEhh9jyipgxe19OcubqV5w
April 1, 2024
267107
Trinidad and Tobago
TTO
true
2
1
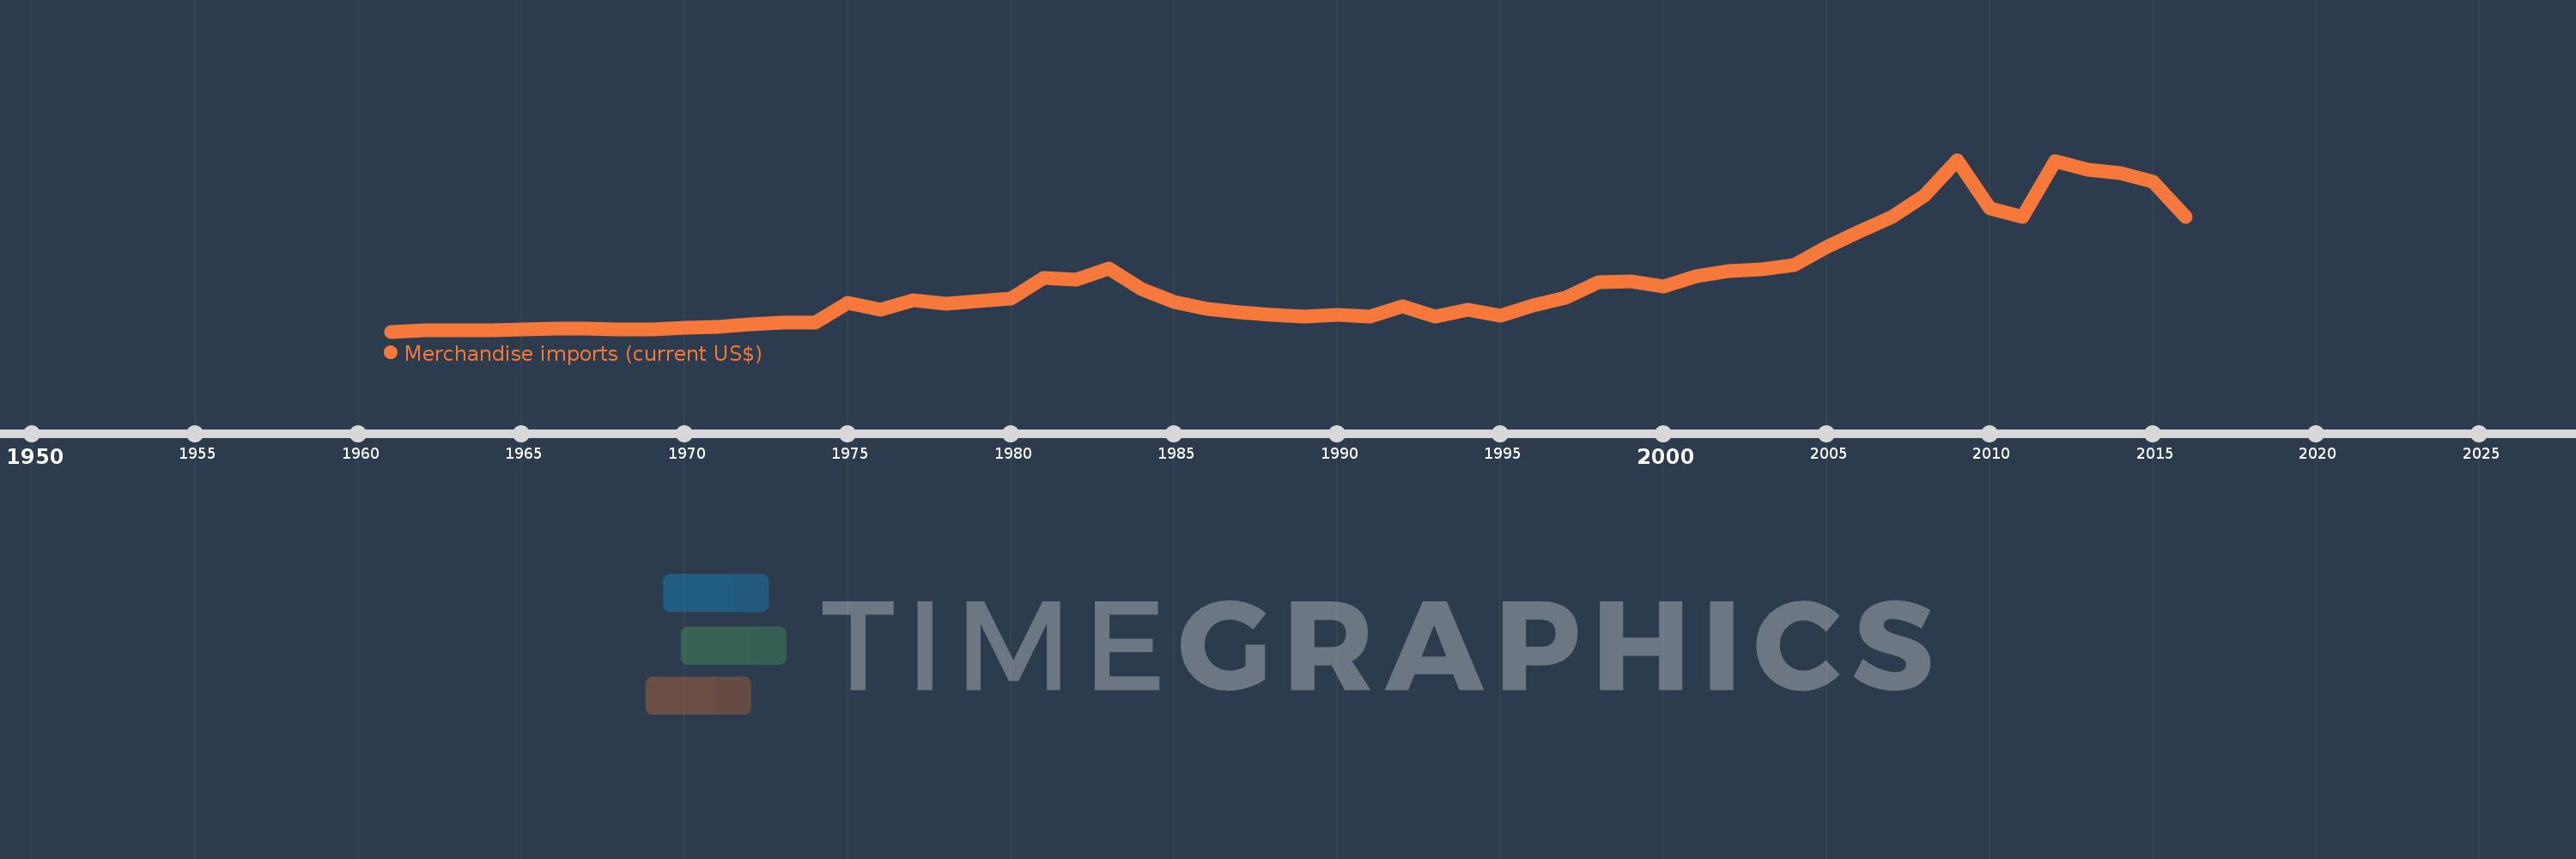
Merchandise imports (current US$)
2016,2015,2014,2013,2012,2011,2010,2009,2008,2007,2006,2005,2004,2003,2002,2001,2000,1999,1998,1997,1996,1995,1994,1993,1992,1991,1990,1989,1988,1987,1986,1985,1984,1983,1982,1981,1980,1979,1978,1977,1976,1975,1974,1973,1972,1971,1970,1969,1968,1967,1966,1965,1964,1963,1962,1961
Cette statistique dans les autres pays:
AfghanistanAlbaniaAlgeriaAmerican SamoaAngolaAntigua and BarbudaArab WorldArgentinaArmeniaArubaAustraliaAustriaAzerbaijanBahamas, TheBahrainBangladeshBarbadosBelarusBelgiumBelizeBeninBermudaBhutanBoliviaBosnia and HerzegovinaBotswanaBrazilBrunei DarussalamBulgariaBurkina FasoBurundiCabo VerdeCambodiaCameroonCanadaCaribbean small statesCentral African RepublicCentral Europe and the BalticsChadChileChinaColombiaComorosCongo, Dem. Rep.Congo, Rep.Costa RicaCote d'IvoireCroatiaCubaCuracaoCyprusCzech RepublicDenmarkDjiboutiDominicaDominican RepublicEarly-demographic dividendEast Asia & PacificEast Asia & Pacific (excluding high income)East Asia & Pacific (IDA & IBRD countries)EcuadorEgypt, Arab Rep.El SalvadorEquatorial GuineaEritreaEstoniaEthiopiaEuro areaEurope & Central AsiaEurope & Central Asia (excluding high income)Europe & Central Asia (IDA & IBRD countries)European UnionFaroe IslandsFijiFinlandFragile and conflict affected situationsFranceFrench PolynesiaGabonGambia, TheGeorgiaGermanyGhanaGreeceGreenlandGrenadaGuatemalaGuineaGuinea-BissauGuyanaHaitiHeavily indebted poor countries (HIPC)High incomeHondurasHong Kong SAR, ChinaHungaryIBRD onlyIcelandIDA & IBRD totalIDA blendIDA onlyIDA totalIndiaIndonesiaIran, Islamic Rep.IraqIrelandIsraelItalyJamaicaJapanJordanKazakhstanKenyaKiribatiKorea, Dem. People’s Rep.Korea, Rep.KuwaitKyrgyz RepublicLao PDRLate-demographic dividendLatin America & Caribbean Latin America & Caribbean (excluding high income)Latin America & the Caribbean (IDA & IBRD countries)LatviaLeast developed countries: UN classificationLebanonLesothoLiberiaLibyaLithuaniaLow & middle incomeLow incomeLower middle incomeLuxembourgMacao SAR, ChinaMacedonia, FYRMadagascarMalawiMalaysiaMaldivesMaliMaltaMarshall IslandsMauritaniaMauritiusMexicoMicronesia, Fed. Sts.Middle East & North AfricaMiddle East & North Africa (excluding high income)Middle East & North Africa (IDA & IBRD countries)Middle incomeMoldovaMongoliaMontenegroMoroccoMozambiqueMyanmarNamibiaNepalNetherlandsNew CaledoniaNew ZealandNicaraguaNigerNigeriaNorth AmericaNorthern Mariana IslandsNorwayOECD membersOmanOther small statesPacific island small statesPakistanPalauPanamaPapua New GuineaParaguayPeruPhilippinesPolandPortugalPost-demographic dividendPre-demographic dividendQatarRomaniaRussian FederationRwandaSamoaSao Tome and PrincipeSaudi ArabiaSenegalSerbiaSeychellesSierra LeoneSingaporeSint Maarten (Dutch part)Slovak RepublicSloveniaSmall statesSolomon IslandsSouth AfricaSouth AsiaSouth Asia (IDA & IBRD)SpainSri LankaSt. Kitts and NevisSt. LuciaSt. Martin (French part)St. Vincent and the GrenadinesSub-Saharan Africa Sub-Saharan Africa (excluding high income)Sub-Saharan Africa (IDA & IBRD countries)SudanSurinameSwazilandSwedenSwitzerlandSyrian Arab RepublicTajikistanTanzaniaThailandTimor-LesteTogoTongaTrinidad and TobagoTunisiaTurkeyTurkmenistanTuvaluUgandaUkraineUnited Arab EmiratesUnited KingdomUnited StatesUpper middle incomeUruguayUzbekistanVanuatuVenezuela, RBVietnamWorldYemen, Rep.ZambiaZimbabwe La ligne de temps
Cette échelle de temps montre un graphique de 1961 année à 2016 année Trinidad and Tobago. Les données jusqu'à 1960 année ne sont pas présentés. Quantité d'observations actuelles selon dates: 56.
Source (désignation):
Les indicateurs du développement mondiale
Source (organisation):
World Trade Organization.
Catégories:
Private Sector, Trade
Dernière mise à jour
23 avr. 2017
Les indicateurs de changement de valeurs selon les années
Minimum:
293.999 mln.
1 janv. 1961
Maximum:
9.591 mds
1 janv. 2009
Pour la date d''observation
Valeur
Changement absolu
Le changement par rapport à la valeur précédente
1 janv. 1961
293.999 mln.
+293.999 mln.
0.0%
1 janv. 1962
340.666 mln.
+46.667 mln.
15.87%
1 janv. 1963
353.266 mln.
+12.6 mln.
3.7%
1 janv. 1964
377.066 mln.
+23.8 mln.
6.74%
1 janv. 1965
426.182 mln.
+49.116 mln.
13.03%
1 janv. 1966
471.449 mln.
+45.267 mln.
10.62%
1 janv. 1967
453.657 mln.
-17.792 mln.
-3.77%
1 janv. 1968
416.642 mln.
-37.015 mln.
-8.16%
1 janv. 1969
420.05 mln.
+3.408 mln.
0.82%
1 janv. 1970
482.7 mln.
+62.65 mln.
14.91%
1 janv. 1971
543.5 mln.
+60.8 mln.
12.6%
1 janv. 1972
666.496 mln.
+122.996 mln.
22.63%
1 janv. 1973
765.887 mln.
+99.391 mln.
14.91%
1 janv. 1974
796.759 mln.
+30.872 mln.
4.03%
1 janv. 1975
1.846 mds
+1.049 mds
131.67%
1 janv. 1976
1.469 mds
-376.79 mln.
-20.41%
1 janv. 1977
2.01 mds
+540.51 mln.
36.79%
1 janv. 1978
1.819 mds
-190.77 mln.
-9.49%
1 janv. 1979
1.967 mds
+148.25 mln.
8.15%
1 janv. 1980
2.105 mds
+137.5 mln.
6.99%
1 janv. 1981
3.178 mds
+1.073 mds
51.0%
1 janv. 1982
3.125 mds
-53.0 mln.
-1.67%
1 janv. 1983
3.698 mds
+573.0 mln.
18.34%
1 janv. 1984
2.582 mds
-1.116 mds
-30.18%
1 janv. 1985
1.919 mds
-663.0 mln.
-25.68%
1 janv. 1986
1.533 mds
-386.0 mln.
-20.11%
1 janv. 1987
1.35 mds
-183.0 mln.
-11.94%
1 janv. 1988
1.219 mds
-131.0 mln.
-9.7%
1 janv. 1989
1.127 mds
-92.0 mln.
-7.55%
1 janv. 1990
1.222 mds
+95.0 mln.
8.43%
1 janv. 1991
1.109 mds
-113.0 mln.
-9.25%
1 janv. 1992
1.667 mds
+558.0 mln.
50.32%
1 janv. 1993
1.104 mds
-563.0 mln.
-33.77%
1 janv. 1994
1.463 mds
+359.0 mln.
32.52%
1 janv. 1995
1.134 mds
-329.0 mln.
-22.49%
1 janv. 1996
1.714 mds
+580.0 mln.
51.15%
1 janv. 1997
2.144 mds
+430.0 mln.
25.09%
1 janv. 1998
2.99 mds
+846.0 mln.
39.46%
1 janv. 1999
2.999 mds
+9.0 mln.
0.3%
1 janv. 2000
2.741 mds
-258.0 mln.
-8.6%
1 janv. 2001
3.308 mds
+567.0 mln.
20.69%
1 janv. 2002
3.569 mds
+261.0 mln.
7.89%
1 janv. 2003
3.643 mds
+74.0 mln.
2.07%
1 janv. 2004
3.892 mds
+249.0 mln.
6.84%
1 janv. 2005
4.858 mds
+966.01 mln.
24.82%
1 janv. 2006
5.694 mds
+835.899 mln.
17.21%
1 janv. 2007
6.484 mds
+790.571 mln.
13.88%
1 janv. 2008
7.663 mds
+1.178 mds
18.17%
1 janv. 2009
9.591 mds
+1.929 mds
25.17%
1 janv. 2010
6.955 mds
-2.636 mds
-27.48%
1 janv. 2011
6.48 mds
-475.838 mln.
-6.84%
1 janv. 2012
9.511 mds
+3.031 mds
46.78%
1 janv. 2013
9.065 mds
-445.95 mln.
-4.69%
1 janv. 2014
8.871 mds
-194.19 mln.
-2.14%
1 janv. 2015
8.386 mds
-485.1 mln.
-5.47%
1 janv. 2016
6.495 mds
-1.891 mds
-22.55%
Classement des pays selon les statistiques actuelles par années


Commentaires: