29
/fr/
fr
AIzaSyAYiBZKx7MnpbEhh9jyipgxe19OcubqV5w
April 1, 2024
274988
United Arab Emirates
ARE
true
2
1
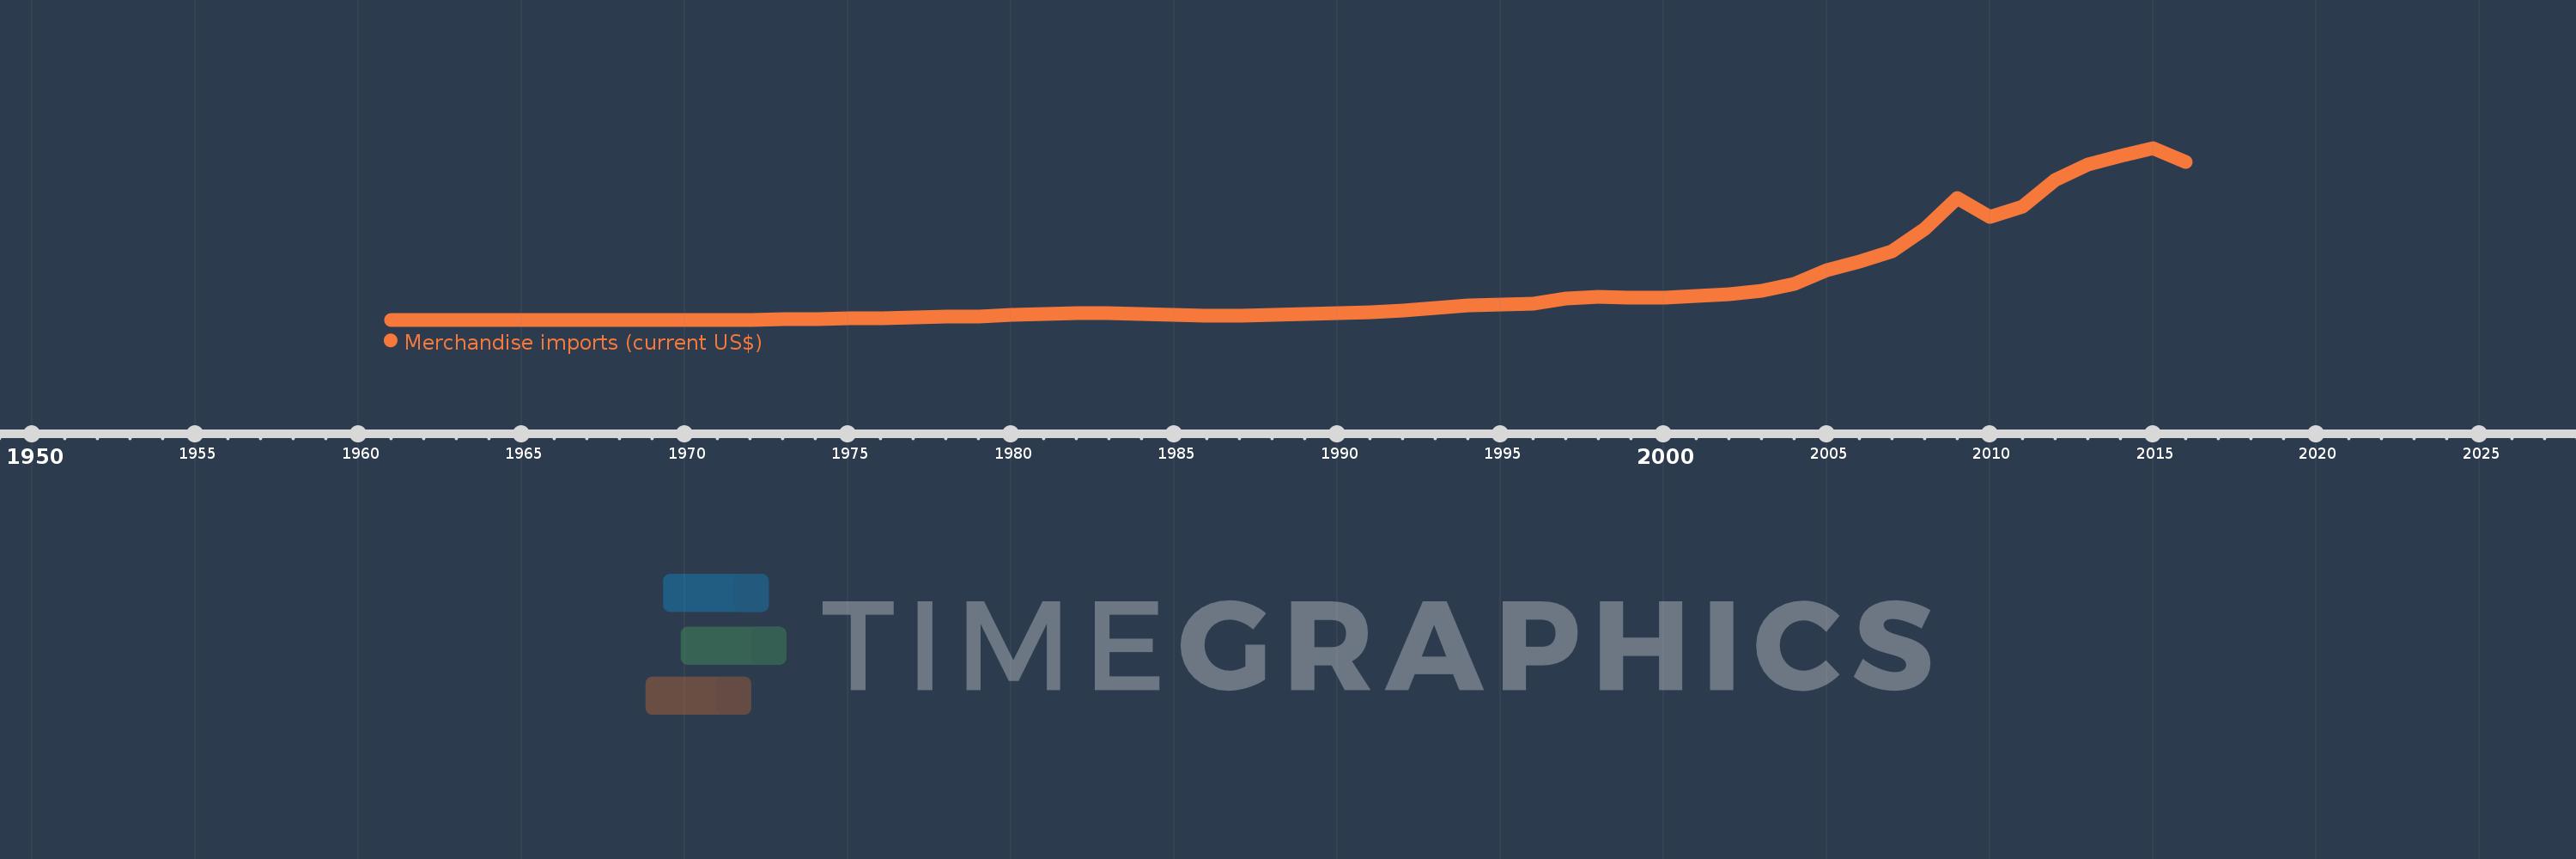
Merchandise imports (current US$)
2016,2015,2014,2013,2012,2011,2010,2009,2008,2007,2006,2005,2004,2003,2002,2001,2000,1999,1998,1997,1996,1995,1994,1993,1992,1991,1990,1989,1988,1987,1986,1985,1984,1983,1982,1981,1980,1979,1978,1977,1976,1975,1974,1973,1972,1971,1970,1969,1968,1967,1966,1965,1964,1963,1962,1961
Cette statistique dans les autres pays:
AfghanistanAlbaniaAlgeriaAmerican SamoaAngolaAntigua and BarbudaArab WorldArgentinaArmeniaArubaAustraliaAustriaAzerbaijanBahamas, TheBahrainBangladeshBarbadosBelarusBelgiumBelizeBeninBermudaBhutanBoliviaBosnia and HerzegovinaBotswanaBrazilBrunei DarussalamBulgariaBurkina FasoBurundiCabo VerdeCambodiaCameroonCanadaCaribbean small statesCentral African RepublicCentral Europe and the BalticsChadChileChinaColombiaComorosCongo, Dem. Rep.Congo, Rep.Costa RicaCote d'IvoireCroatiaCubaCuracaoCyprusCzech RepublicDenmarkDjiboutiDominicaDominican RepublicEarly-demographic dividendEast Asia & PacificEast Asia & Pacific (excluding high income)East Asia & Pacific (IDA & IBRD countries)EcuadorEgypt, Arab Rep.El SalvadorEquatorial GuineaEritreaEstoniaEthiopiaEuro areaEurope & Central AsiaEurope & Central Asia (excluding high income)Europe & Central Asia (IDA & IBRD countries)European UnionFaroe IslandsFijiFinlandFragile and conflict affected situationsFranceFrench PolynesiaGabonGambia, TheGeorgiaGermanyGhanaGreeceGreenlandGrenadaGuatemalaGuineaGuinea-BissauGuyanaHaitiHeavily indebted poor countries (HIPC)High incomeHondurasHong Kong SAR, ChinaHungaryIBRD onlyIcelandIDA & IBRD totalIDA blendIDA onlyIDA totalIndiaIndonesiaIran, Islamic Rep.IraqIrelandIsraelItalyJamaicaJapanJordanKazakhstanKenyaKiribatiKorea, Dem. People’s Rep.Korea, Rep.KuwaitKyrgyz RepublicLao PDRLate-demographic dividendLatin America & Caribbean Latin America & Caribbean (excluding high income)Latin America & the Caribbean (IDA & IBRD countries)LatviaLeast developed countries: UN classificationLebanonLesothoLiberiaLibyaLithuaniaLow & middle incomeLow incomeLower middle incomeLuxembourgMacao SAR, ChinaMacedonia, FYRMadagascarMalawiMalaysiaMaldivesMaliMaltaMarshall IslandsMauritaniaMauritiusMexicoMicronesia, Fed. Sts.Middle East & North AfricaMiddle East & North Africa (excluding high income)Middle East & North Africa (IDA & IBRD countries)Middle incomeMoldovaMongoliaMontenegroMoroccoMozambiqueMyanmarNamibiaNepalNetherlandsNew CaledoniaNew ZealandNicaraguaNigerNigeriaNorth AmericaNorthern Mariana IslandsNorwayOECD membersOmanOther small statesPacific island small statesPakistanPalauPanamaPapua New GuineaParaguayPeruPhilippinesPolandPortugalPost-demographic dividendPre-demographic dividendQatarRomaniaRussian FederationRwandaSamoaSao Tome and PrincipeSaudi ArabiaSenegalSerbiaSeychellesSierra LeoneSingaporeSint Maarten (Dutch part)Slovak RepublicSloveniaSmall statesSolomon IslandsSouth AfricaSouth AsiaSouth Asia (IDA & IBRD)SpainSri LankaSt. Kitts and NevisSt. LuciaSt. Martin (French part)St. Vincent and the GrenadinesSub-Saharan Africa Sub-Saharan Africa (excluding high income)Sub-Saharan Africa (IDA & IBRD countries)SudanSurinameSwazilandSwedenSwitzerlandSyrian Arab RepublicTajikistanTanzaniaThailandTimor-LesteTogoTongaTrinidad and TobagoTunisiaTurkeyTurkmenistanTuvaluUgandaUkraineUnited Arab EmiratesUnited KingdomUnited StatesUpper middle incomeUruguayUzbekistanVanuatuVenezuela, RBVietnamWorldYemen, Rep.ZambiaZimbabwe La ligne de temps
Cette échelle de temps montre un graphique de 1961 année à 2016 année United Arab Emirates. Les données jusqu'à 1960 année ne sont pas présentés. Quantité d'observations actuelles selon dates: 56.
Source (désignation):
Les indicateurs du développement mondiale
Source (organisation):
World Trade Organization.
Catégories:
Private Sector, Trade
Dernière mise à jour
23 avr. 2017
Les indicateurs de changement de valeurs selon les années
Minimum:
160.0 mln.
1 janv. 1961
Maximum:
250.0 mds
1 janv. 2015
Pour la date d''observation
Valeur
Changement absolu
Le changement par rapport à la valeur précédente
1 janv. 1961
160.0 mln.
+160.0 mln.
0.0%
1 janv. 1962
170.0 mln.
+10.0 mln.
6.25%
1 janv. 1963
170.0 mln.
0.0
0.0%
1 janv. 1964
180.0 mln.
+10.0 mln.
5.88%
1 janv. 1965
205.0 mln.
+25.0 mln.
13.89%
1 janv. 1966
225.0 mln.
+20.0 mln.
9.76%
1 janv. 1967
237.0 mln.
+12.0 mln.
5.33%
1 janv. 1968
240.0 mln.
+3.0 mln.
1.27%
1 janv. 1969
280.0 mln.
+40.0 mln.
16.67%
1 janv. 1970
307.02 mln.
+27.02 mln.
9.65%
1 janv. 1971
267.12 mln.
-39.9 mln.
-13.0%
1 janv. 1972
309.396 mln.
+42.276 mln.
15.83%
1 janv. 1973
481.763 mln.
+172.367 mln.
55.71%
1 janv. 1974
820.515 mln.
+338.752 mln.
70.32%
1 janv. 1975
1.705 mds
+884.445 mln.
107.79%
1 janv. 1976
2.685 mds
+979.75 mln.
57.46%
1 janv. 1977
3.337 mds
+652.44 mln.
24.3%
1 janv. 1978
5.055 mds
+1.718 mds
51.49%
1 janv. 1979
5.371 mds
+315.16 mln.
6.23%
1 janv. 1980
6.966 mds
+1.596 mds
29.71%
1 janv. 1981
8.746 mds
+1.78 mds
25.55%
1 janv. 1982
9.646 mds
+900.0 mln.
10.29%
1 janv. 1983
9.44 mds
-206.0 mln.
-2.14%
1 janv. 1984
8.294 mds
-1.146 mds
-12.14%
1 janv. 1985
6.936 mds
-1.358 mds
-16.37%
1 janv. 1986
6.549 mds
-387.0 mln.
-5.58%
1 janv. 1987
6.422 mds
-127.0 mln.
-1.94%
1 janv. 1988
7.226 mds
+804.0 mln.
12.52%
1 janv. 1989
8.522 mds
+1.296 mds
17.94%
1 janv. 1990
10.01 mds
+1.488 mds
17.46%
1 janv. 1991
11.199 mds
+1.189 mds
11.88%
1 janv. 1992
13.746 mds
+2.547 mds
22.74%
1 janv. 1993
17.41 mds
+3.664 mds
26.66%
1 janv. 1994
20.994 mds
+3.584 mds
20.58%
1 janv. 1995
22.775 mds
+1.781 mds
8.48%
1 janv. 1996
23.778 mds
+1.003 mds
4.4%
1 janv. 1997
30.563 mds
+6.785 mds
28.54%
1 janv. 1998
34.107 mds
+3.544 mds
11.59%
1 janv. 1999
32.588 mds
-1.518 mds
-4.45%
1 janv. 2000
31.721 mds
-867.529 mln.
-2.66%
1 janv. 2001
35.009 mds
+3.288 mds
10.37%
1 janv. 2002
37.293 mds
+2.285 mds
6.53%
1 janv. 2003
42.652 mds
+5.359 mds
14.37%
1 janv. 2004
52.074 mds
+9.421 mds
22.09%
1 janv. 2005
72.082 mds
+20.008 mds
38.42%
1 janv. 2006
84.654 mds
+12.572 mds
17.44%
1 janv. 2007
100.057 mds
+15.403 mds
18.2%
1 janv. 2008
132.5 mds
+32.443 mds
32.42%
1 janv. 2009
177.0 mds
+44.5 mds
33.58%
1 janv. 2010
150.0 mds
-27.0 mds
-15.25%
1 janv. 2011
165.0 mds
+15.0 mds
10.0%
1 janv. 2012
203.0 mds
+38.0 mds
23.03%
1 janv. 2013
226.0 mds
+23.0 mds
11.33%
1 janv. 2014
239.0 mds
+13.0 mds
5.75%
1 janv. 2015
250.0 mds
+11.0 mds
4.6%
1 janv. 2016
230.0 mds
-20.0 mds
-8.0%
Classement des pays selon les statistiques actuelles par années


Commentaires: