29
/fr/
fr
AIzaSyAYiBZKx7MnpbEhh9jyipgxe19OcubqV5w
April 1, 2024
183134
Macao SAR, China
MAC
true
2
1
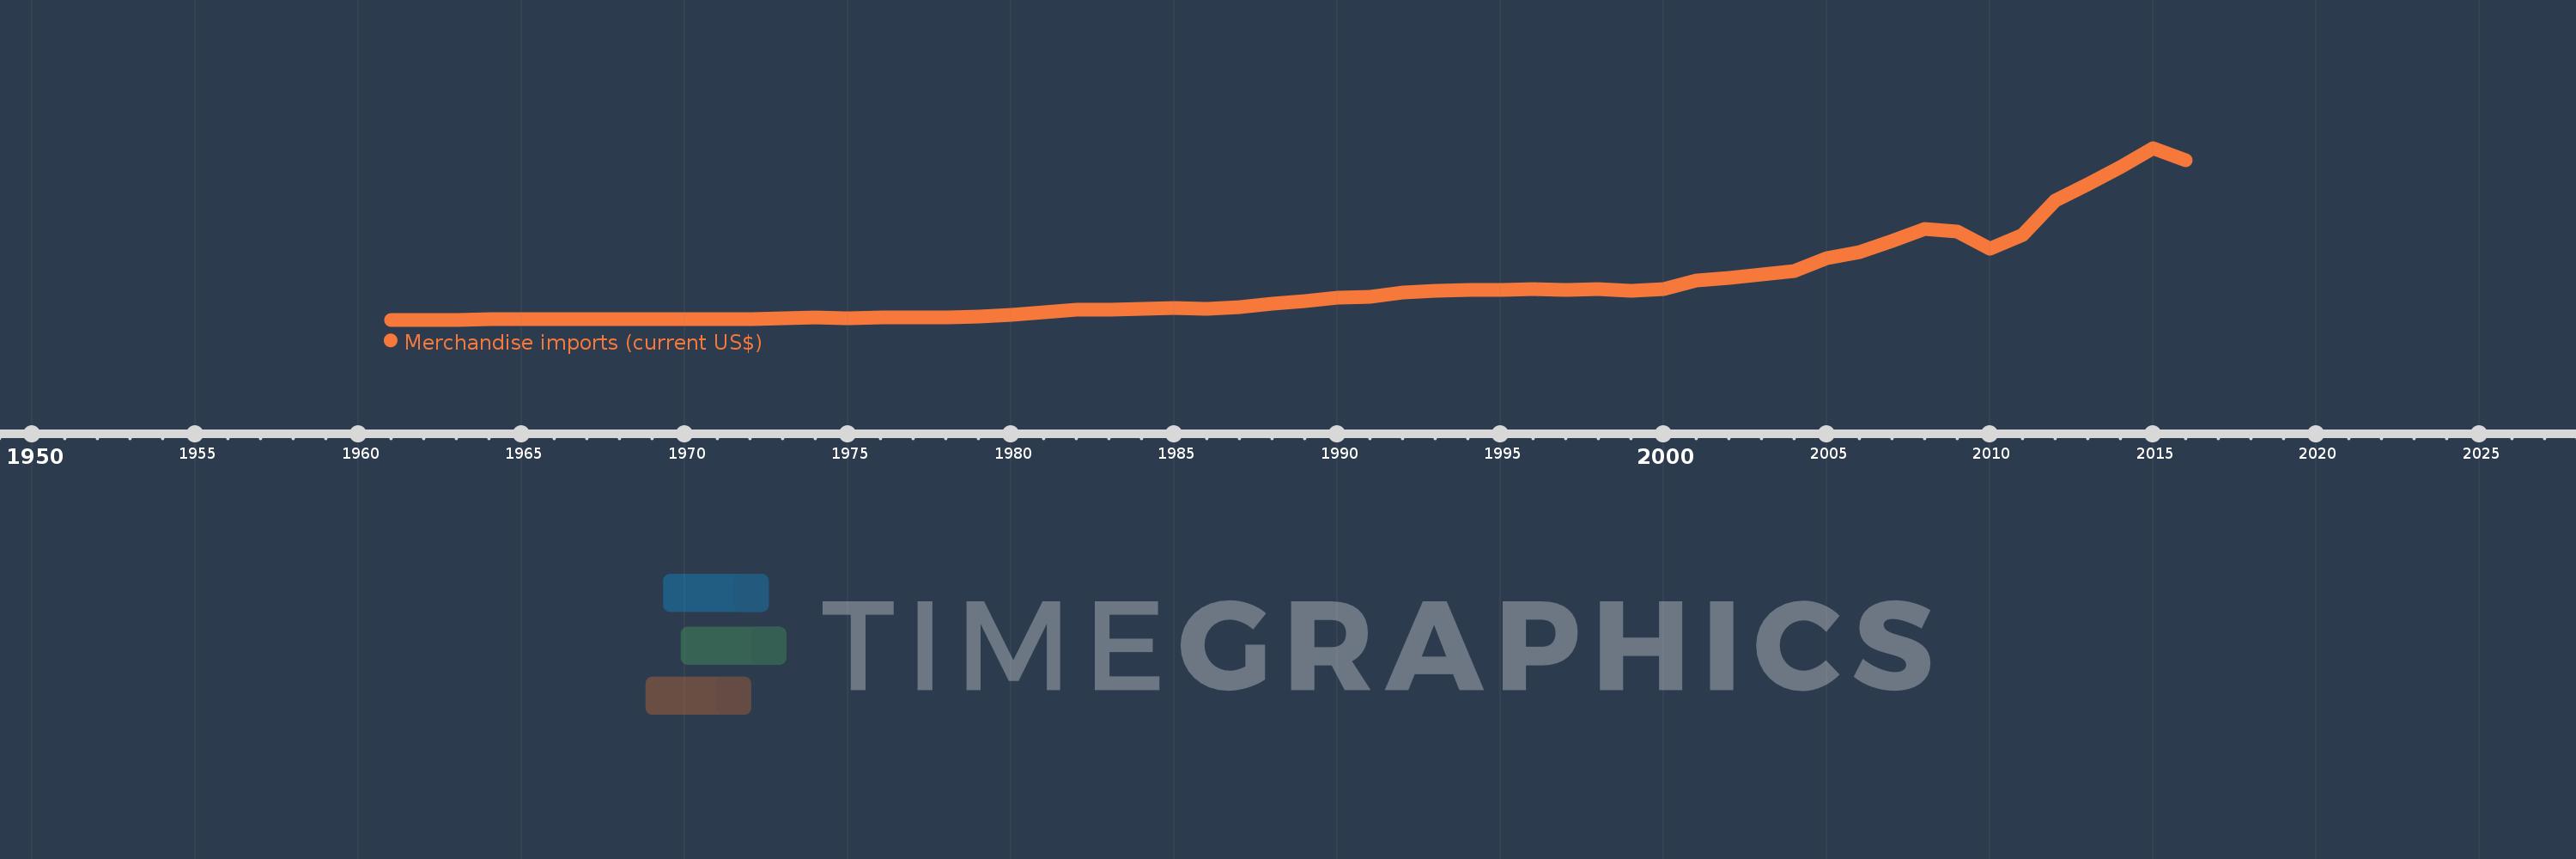
Merchandise imports (current US$)
2016,2015,2014,2013,2012,2011,2010,2009,2008,2007,2006,2005,2004,2003,2002,2001,2000,1999,1998,1997,1996,1995,1994,1993,1992,1991,1990,1989,1988,1987,1986,1985,1984,1983,1982,1981,1980,1979,1978,1977,1976,1975,1974,1973,1972,1971,1970,1969,1968,1967,1966,1965,1964,1963,1962,1961
Cette statistique dans les autres pays:
AfghanistanAlbaniaAlgeriaAmerican SamoaAngolaAntigua and BarbudaArab WorldArgentinaArmeniaArubaAustraliaAustriaAzerbaijanBahamas, TheBahrainBangladeshBarbadosBelarusBelgiumBelizeBeninBermudaBhutanBoliviaBosnia and HerzegovinaBotswanaBrazilBrunei DarussalamBulgariaBurkina FasoBurundiCabo VerdeCambodiaCameroonCanadaCaribbean small statesCentral African RepublicCentral Europe and the BalticsChadChileChinaColombiaComorosCongo, Dem. Rep.Congo, Rep.Costa RicaCote d'IvoireCroatiaCubaCuracaoCyprusCzech RepublicDenmarkDjiboutiDominicaDominican RepublicEarly-demographic dividendEast Asia & PacificEast Asia & Pacific (excluding high income)East Asia & Pacific (IDA & IBRD countries)EcuadorEgypt, Arab Rep.El SalvadorEquatorial GuineaEritreaEstoniaEthiopiaEuro areaEurope & Central AsiaEurope & Central Asia (excluding high income)Europe & Central Asia (IDA & IBRD countries)European UnionFaroe IslandsFijiFinlandFragile and conflict affected situationsFranceFrench PolynesiaGabonGambia, TheGeorgiaGermanyGhanaGreeceGreenlandGrenadaGuatemalaGuineaGuinea-BissauGuyanaHaitiHeavily indebted poor countries (HIPC)High incomeHondurasHong Kong SAR, ChinaHungaryIBRD onlyIcelandIDA & IBRD totalIDA blendIDA onlyIDA totalIndiaIndonesiaIran, Islamic Rep.IraqIrelandIsraelItalyJamaicaJapanJordanKazakhstanKenyaKiribatiKorea, Dem. People’s Rep.Korea, Rep.KuwaitKyrgyz RepublicLao PDRLate-demographic dividendLatin America & Caribbean Latin America & Caribbean (excluding high income)Latin America & the Caribbean (IDA & IBRD countries)LatviaLeast developed countries: UN classificationLebanonLesothoLiberiaLibyaLithuaniaLow & middle incomeLow incomeLower middle incomeLuxembourgMacao SAR, ChinaMacedonia, FYRMadagascarMalawiMalaysiaMaldivesMaliMaltaMarshall IslandsMauritaniaMauritiusMexicoMicronesia, Fed. Sts.Middle East & North AfricaMiddle East & North Africa (excluding high income)Middle East & North Africa (IDA & IBRD countries)Middle incomeMoldovaMongoliaMontenegroMoroccoMozambiqueMyanmarNamibiaNepalNetherlandsNew CaledoniaNew ZealandNicaraguaNigerNigeriaNorth AmericaNorthern Mariana IslandsNorwayOECD membersOmanOther small statesPacific island small statesPakistanPalauPanamaPapua New GuineaParaguayPeruPhilippinesPolandPortugalPost-demographic dividendPre-demographic dividendQatarRomaniaRussian FederationRwandaSamoaSao Tome and PrincipeSaudi ArabiaSenegalSerbiaSeychellesSierra LeoneSingaporeSint Maarten (Dutch part)Slovak RepublicSloveniaSmall statesSolomon IslandsSouth AfricaSouth AsiaSouth Asia (IDA & IBRD)SpainSri LankaSt. Kitts and NevisSt. LuciaSt. Martin (French part)St. Vincent and the GrenadinesSub-Saharan Africa Sub-Saharan Africa (excluding high income)Sub-Saharan Africa (IDA & IBRD countries)SudanSurinameSwazilandSwedenSwitzerlandSyrian Arab RepublicTajikistanTanzaniaThailandTimor-LesteTogoTongaTrinidad and TobagoTunisiaTurkeyTurkmenistanTuvaluUgandaUkraineUnited Arab EmiratesUnited KingdomUnited StatesUpper middle incomeUruguayUzbekistanVanuatuVenezuela, RBVietnamWorldYemen, Rep.ZambiaZimbabwe La ligne de temps
Cette échelle de temps montre un graphique de 1961 année à 2016 année Macao SAR, China. Les données jusqu'à 1960 année ne sont pas présentés. Quantité d'observations actuelles selon dates: 56.
Source (désignation):
Les indicateurs du développement mondiale
Source (organisation):
World Trade Organization.
Catégories:
Private Sector, Trade
Dernière mise à jour
23 avr. 2017
Les indicateurs de changement de valeurs selon les années
Minimum:
30.35 mln.
1 janv. 1961
Maximum:
11.396 mds
1 janv. 2015
Pour la date d''observation
Valeur
Changement absolu
Le changement par rapport à la valeur précédente
1 janv. 1961
30.35 mln.
+30.35 mln.
0.0%
1 janv. 1962
31.73 mln.
+1.38 mln.
4.55%
1 janv. 1963
37.69 mln.
+5.96 mln.
18.78%
1 janv. 1964
41.91 mln.
+4.22 mln.
11.2%
1 janv. 1965
48.1 mln.
+6.19 mln.
14.77%
1 janv. 1966
46.93 mln.
-1.17 mln.
-2.43%
1 janv. 1967
51.1 mln.
+4.17 mln.
8.89%
1 janv. 1968
42.529 mln.
-8.57 mln.
-16.77%
1 janv. 1969
49.938 mln.
+7.408 mln.
17.42%
1 janv. 1970
59.659 mln.
+9.722 mln.
19.47%
1 janv. 1971
64.953 mln.
+5.294 mln.
8.87%
1 janv. 1972
75.332 mln.
+10.379 mln.
15.98%
1 janv. 1973
103.713 mln.
+28.381 mln.
37.67%
1 janv. 1974
157.723 mln.
+54.01 mln.
52.08%
1 janv. 1975
134.343 mln.
-23.38 mln.
-14.82%
1 janv. 1976
160.852 mln.
+26.509 mln.
19.73%
1 janv. 1977
160.89 mln.
+38.0 milles
0.02%
1 janv. 1978
198.233 mln.
+37.343 mln.
23.21%
1 janv. 1979
248.822 mln.
+50.589 mln.
25.52%
1 janv. 1980
351.385 mln.
+102.563 mln.
41.22%
1 janv. 1981
544.0 mln.
+192.615 mln.
54.82%
1 janv. 1982
711.0 mln.
+167.0 mln.
30.7%
1 janv. 1983
719.0 mln.
+8.0 mln.
1.13%
1 janv. 1984
727.0 mln.
+8.0 mln.
1.11%
1 janv. 1985
795.0 mln.
+68.0 mln.
9.35%
1 janv. 1986
778.0 mln.
-17.0 mln.
-2.14%
1 janv. 1987
879.0 mln.
+101.0 mln.
12.98%
1 janv. 1988
1.12 mds
+241.0 mln.
27.42%
1 janv. 1989
1.288 mds
+168.0 mln.
15.0%
1 janv. 1990
1.48 mds
+192.0 mln.
14.91%
1 janv. 1991
1.539 mds
+59.0 mln.
3.99%
1 janv. 1992
1.852 mds
+313.0 mln.
20.34%
1 janv. 1993
1.968 mds
+116.0 mln.
6.26%
1 janv. 1994
2.025 mds
+57.0 mln.
2.9%
1 janv. 1995
2.001 mds
-24.0 mln.
-1.19%
1 janv. 1996
2.042 mds
+41.0 mln.
2.05%
1 janv. 1997
2.0 mds
-42.0 mln.
-2.06%
1 janv. 1998
2.082 mds
+82.0 mln.
4.1%
1 janv. 1999
1.955 mds
-127.0 mln.
-6.1%
1 janv. 2000
2.04 mds
+85.0 mln.
4.35%
1 janv. 2001
2.625 mds
+585.223 mln.
28.69%
1 janv. 2002
2.824 mds
+198.278 mln.
7.55%
1 janv. 2003
3.009 mds
+185.62 mln.
6.57%
1 janv. 2004
3.232 mds
+223.202 mln.
7.42%
1 janv. 2005
4.094 mds
+861.431 mln.
26.65%
1 janv. 2006
4.514 mds
+420.517 mln.
10.27%
1 janv. 2007
5.236 mds
+721.254 mln.
15.98%
1 janv. 2008
6.045 mds
+809.216 mln.
15.46%
1 janv. 2009
5.88 mds
-164.887 mln.
-2.73%
1 janv. 2010
4.751 mds
-1.129 mds
-19.2%
1 janv. 2011
5.629 mds
+878.507 mln.
18.49%
1 janv. 2012
7.927 mds
+2.297 mds
40.81%
1 janv. 2013
8.982 mds
+1.055 mds
13.31%
1 janv. 2014
10.14 mds
+1.158 mds
12.9%
1 janv. 2015
11.396 mds
+1.256 mds
12.38%
1 janv. 2016
10.603 mds
-793.098 mln.
-6.96%
Classement des pays selon les statistiques actuelles par années


Commentaires: