29
/fr/
fr
AIzaSyAYiBZKx7MnpbEhh9jyipgxe19OcubqV5w
April 1, 2024
243839
Solomon Islands
SLB
true
2
1
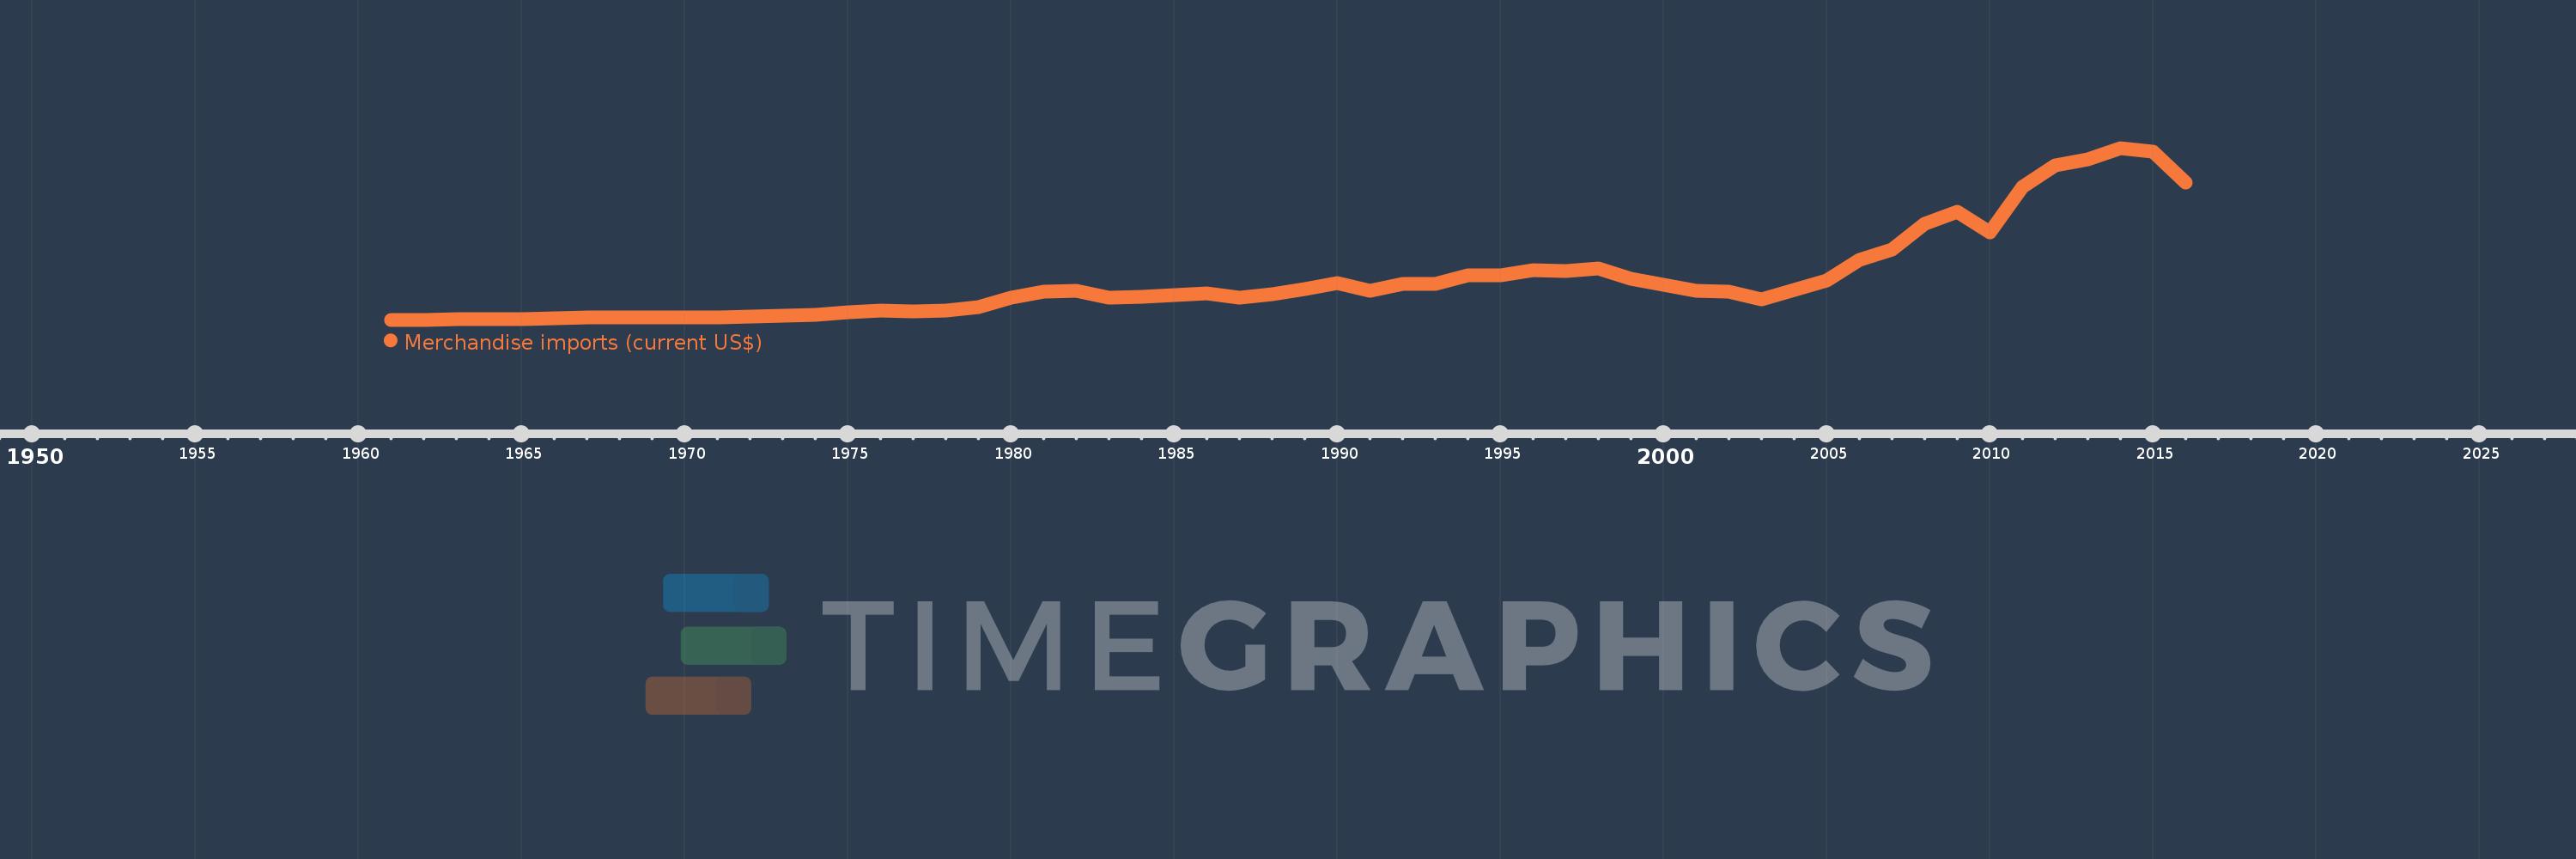
Merchandise imports (current US$)
2016,2015,2014,2013,2012,2011,2010,2009,2008,2007,2006,2005,2004,2003,2002,2001,2000,1999,1998,1997,1996,1995,1994,1993,1992,1991,1990,1989,1988,1987,1986,1985,1984,1983,1982,1981,1980,1979,1978,1977,1976,1975,1974,1973,1972,1971,1970,1969,1968,1967,1966,1965,1964,1963,1962,1961
Cette statistique dans les autres pays:
AfghanistanAlbaniaAlgeriaAmerican SamoaAngolaAntigua and BarbudaArab WorldArgentinaArmeniaArubaAustraliaAustriaAzerbaijanBahamas, TheBahrainBangladeshBarbadosBelarusBelgiumBelizeBeninBermudaBhutanBoliviaBosnia and HerzegovinaBotswanaBrazilBrunei DarussalamBulgariaBurkina FasoBurundiCabo VerdeCambodiaCameroonCanadaCaribbean small statesCentral African RepublicCentral Europe and the BalticsChadChileChinaColombiaComorosCongo, Dem. Rep.Congo, Rep.Costa RicaCote d'IvoireCroatiaCubaCuracaoCyprusCzech RepublicDenmarkDjiboutiDominicaDominican RepublicEarly-demographic dividendEast Asia & PacificEast Asia & Pacific (excluding high income)East Asia & Pacific (IDA & IBRD countries)EcuadorEgypt, Arab Rep.El SalvadorEquatorial GuineaEritreaEstoniaEthiopiaEuro areaEurope & Central AsiaEurope & Central Asia (excluding high income)Europe & Central Asia (IDA & IBRD countries)European UnionFaroe IslandsFijiFinlandFragile and conflict affected situationsFranceFrench PolynesiaGabonGambia, TheGeorgiaGermanyGhanaGreeceGreenlandGrenadaGuatemalaGuineaGuinea-BissauGuyanaHaitiHeavily indebted poor countries (HIPC)High incomeHondurasHong Kong SAR, ChinaHungaryIBRD onlyIcelandIDA & IBRD totalIDA blendIDA onlyIDA totalIndiaIndonesiaIran, Islamic Rep.IraqIrelandIsraelItalyJamaicaJapanJordanKazakhstanKenyaKiribatiKorea, Dem. People’s Rep.Korea, Rep.KuwaitKyrgyz RepublicLao PDRLate-demographic dividendLatin America & Caribbean Latin America & Caribbean (excluding high income)Latin America & the Caribbean (IDA & IBRD countries)LatviaLeast developed countries: UN classificationLebanonLesothoLiberiaLibyaLithuaniaLow & middle incomeLow incomeLower middle incomeLuxembourgMacao SAR, ChinaMacedonia, FYRMadagascarMalawiMalaysiaMaldivesMaliMaltaMarshall IslandsMauritaniaMauritiusMexicoMicronesia, Fed. Sts.Middle East & North AfricaMiddle East & North Africa (excluding high income)Middle East & North Africa (IDA & IBRD countries)Middle incomeMoldovaMongoliaMontenegroMoroccoMozambiqueMyanmarNamibiaNepalNetherlandsNew CaledoniaNew ZealandNicaraguaNigerNigeriaNorth AmericaNorthern Mariana IslandsNorwayOECD membersOmanOther small statesPacific island small statesPakistanPalauPanamaPapua New GuineaParaguayPeruPhilippinesPolandPortugalPost-demographic dividendPre-demographic dividendQatarRomaniaRussian FederationRwandaSamoaSao Tome and PrincipeSaudi ArabiaSenegalSerbiaSeychellesSierra LeoneSingaporeSint Maarten (Dutch part)Slovak RepublicSloveniaSmall statesSolomon IslandsSouth AfricaSouth AsiaSouth Asia (IDA & IBRD)SpainSri LankaSt. Kitts and NevisSt. LuciaSt. Martin (French part)St. Vincent and the GrenadinesSub-Saharan Africa Sub-Saharan Africa (excluding high income)Sub-Saharan Africa (IDA & IBRD countries)SudanSurinameSwazilandSwedenSwitzerlandSyrian Arab RepublicTajikistanTanzaniaThailandTimor-LesteTogoTongaTrinidad and TobagoTunisiaTurkeyTurkmenistanTuvaluUgandaUkraineUnited Arab EmiratesUnited KingdomUnited StatesUpper middle incomeUruguayUzbekistanVanuatuVenezuela, RBVietnamWorldYemen, Rep.ZambiaZimbabwe La ligne de temps
Cette échelle de temps montre un graphique de 1961 année à 2016 année Solomon Islands. Les données jusqu'à 1960 année ne sont pas présentés. Quantité d'observations actuelles selon dates: 56.
Source (désignation):
Les indicateurs du développement mondiale
Source (organisation):
World Trade Organization.
Catégories:
Private Sector, Trade
Dernière mise à jour
23 avr. 2017
Les indicateurs de changement de valeurs selon les années
Minimum:
4.772 mln.
1 janv. 1961
Maximum:
520.716 mln.
1 janv. 2014
Pour la date d''observation
Valeur
Changement absolu
Le changement par rapport à la valeur précédente
1 janv. 1961
4.772 mln.
+4.772 mln.
0.0%
1 janv. 1962
5.269 mln.
+497.17 milles
10.42%
1 janv. 1963
5.729 mln.
+459.81 milles
8.73%
1 janv. 1964
5.877 mln.
+148.12 milles
2.59%
1 janv. 1965
6.985 mln.
+1.108 mln.
18.85%
1 janv. 1966
8.47 mln.
+1.485 mln.
21.26%
1 janv. 1967
10.978 mln.
+2.508 mln.
29.61%
1 janv. 1968
10.559 mln.
-418.6 milles
-3.81%
1 janv. 1969
11.844 mln.
+1.285 mln.
12.17%
1 janv. 1970
11.005 mln.
-839.7 milles
-7.09%
1 janv. 1971
12.906 mln.
+1.901 mln.
17.28%
1 janv. 1972
15.03 mln.
+2.124 mln.
16.46%
1 janv. 1973
16.554 mln.
+1.525 mln.
10.15%
1 janv. 1974
18.458 mln.
+1.904 mln.
11.5%
1 janv. 1975
26.807 mln.
+8.348 mln.
45.23%
1 janv. 1976
32.785 mln.
+5.979 mln.
22.3%
1 janv. 1977
29.561 mln.
-3.224 mln.
-9.83%
1 janv. 1978
32.849 mln.
+3.288 mln.
11.12%
1 janv. 1979
42.448 mln.
+9.599 mln.
29.22%
1 janv. 1980
69.915 mln.
+27.467 mln.
64.71%
1 janv. 1981
89.0 mln.
+19.085 mln.
27.3%
1 janv. 1982
91.0 mln.
+2.0 mln.
2.25%
1 janv. 1983
71.0 mln.
-20.0 mln.
-21.98%
1 janv. 1984
74.0 mln.
+3.0 mln.
4.23%
1 janv. 1985
79.0 mln.
+5.0 mln.
6.76%
1 janv. 1986
83.0 mln.
+4.0 mln.
5.06%
1 janv. 1987
72.0 mln.
-11.0 mln.
-13.25%
1 janv. 1988
81.0 mln.
+9.0 mln.
12.5%
1 janv. 1989
98.0 mln.
+17.0 mln.
20.99%
1 janv. 1990
114.0 mln.
+16.0 mln.
16.33%
1 janv. 1991
91.0 mln.
-23.0 mln.
-20.18%
1 janv. 1992
112.0 mln.
+21.0 mln.
23.08%
1 janv. 1993
112.0 mln.
0.0
0.0%
1 janv. 1994
137.0 mln.
+25.0 mln.
22.32%
1 janv. 1995
139.0 mln.
+2.0 mln.
1.46%
1 janv. 1996
154.0 mln.
+15.0 mln.
10.79%
1 janv. 1997
151.0 mln.
-3.0 mln.
-1.95%
1 janv. 1998
158.0 mln.
+7.0 mln.
4.64%
1 janv. 1999
128.0 mln.
-30.0 mln.
-18.99%
1 janv. 2000
110.0 mln.
-18.0 mln.
-14.06%
1 janv. 2001
92.0 mln.
-18.0 mln.
-16.36%
1 janv. 2002
90.0 mln.
-2.0 mln.
-2.17%
1 janv. 2003
67.0 mln.
-23.0 mln.
-25.56%
1 janv. 2004
93.847 mln.
+26.847 mln.
40.07%
1 janv. 2005
121.412 mln.
+27.565 mln.
29.37%
1 janv. 2006
185.027 mln.
+63.615 mln.
52.4%
1 janv. 2007
216.816 mln.
+31.789 mln.
17.18%
1 janv. 2008
293.603 mln.
+76.787 mln.
35.42%
1 janv. 2009
328.175 mln.
+34.572 mln.
11.78%
1 janv. 2010
268.075 mln.
-60.1 mln.
-18.31%
1 janv. 2011
404.348 mln.
+136.273 mln.
50.83%
1 janv. 2012
468.53 mln.
+64.182 mln.
15.87%
1 janv. 2013
485.89 mln.
+17.36 mln.
3.71%
1 janv. 2014
520.716 mln.
+34.826 mln.
7.17%
1 janv. 2015
508.739 mln.
-11.977 mln.
-2.3%
1 janv. 2016
417.816 mln.
-90.923 mln.
-17.87%
Classement des pays selon les statistiques actuelles par années


Commentaires: