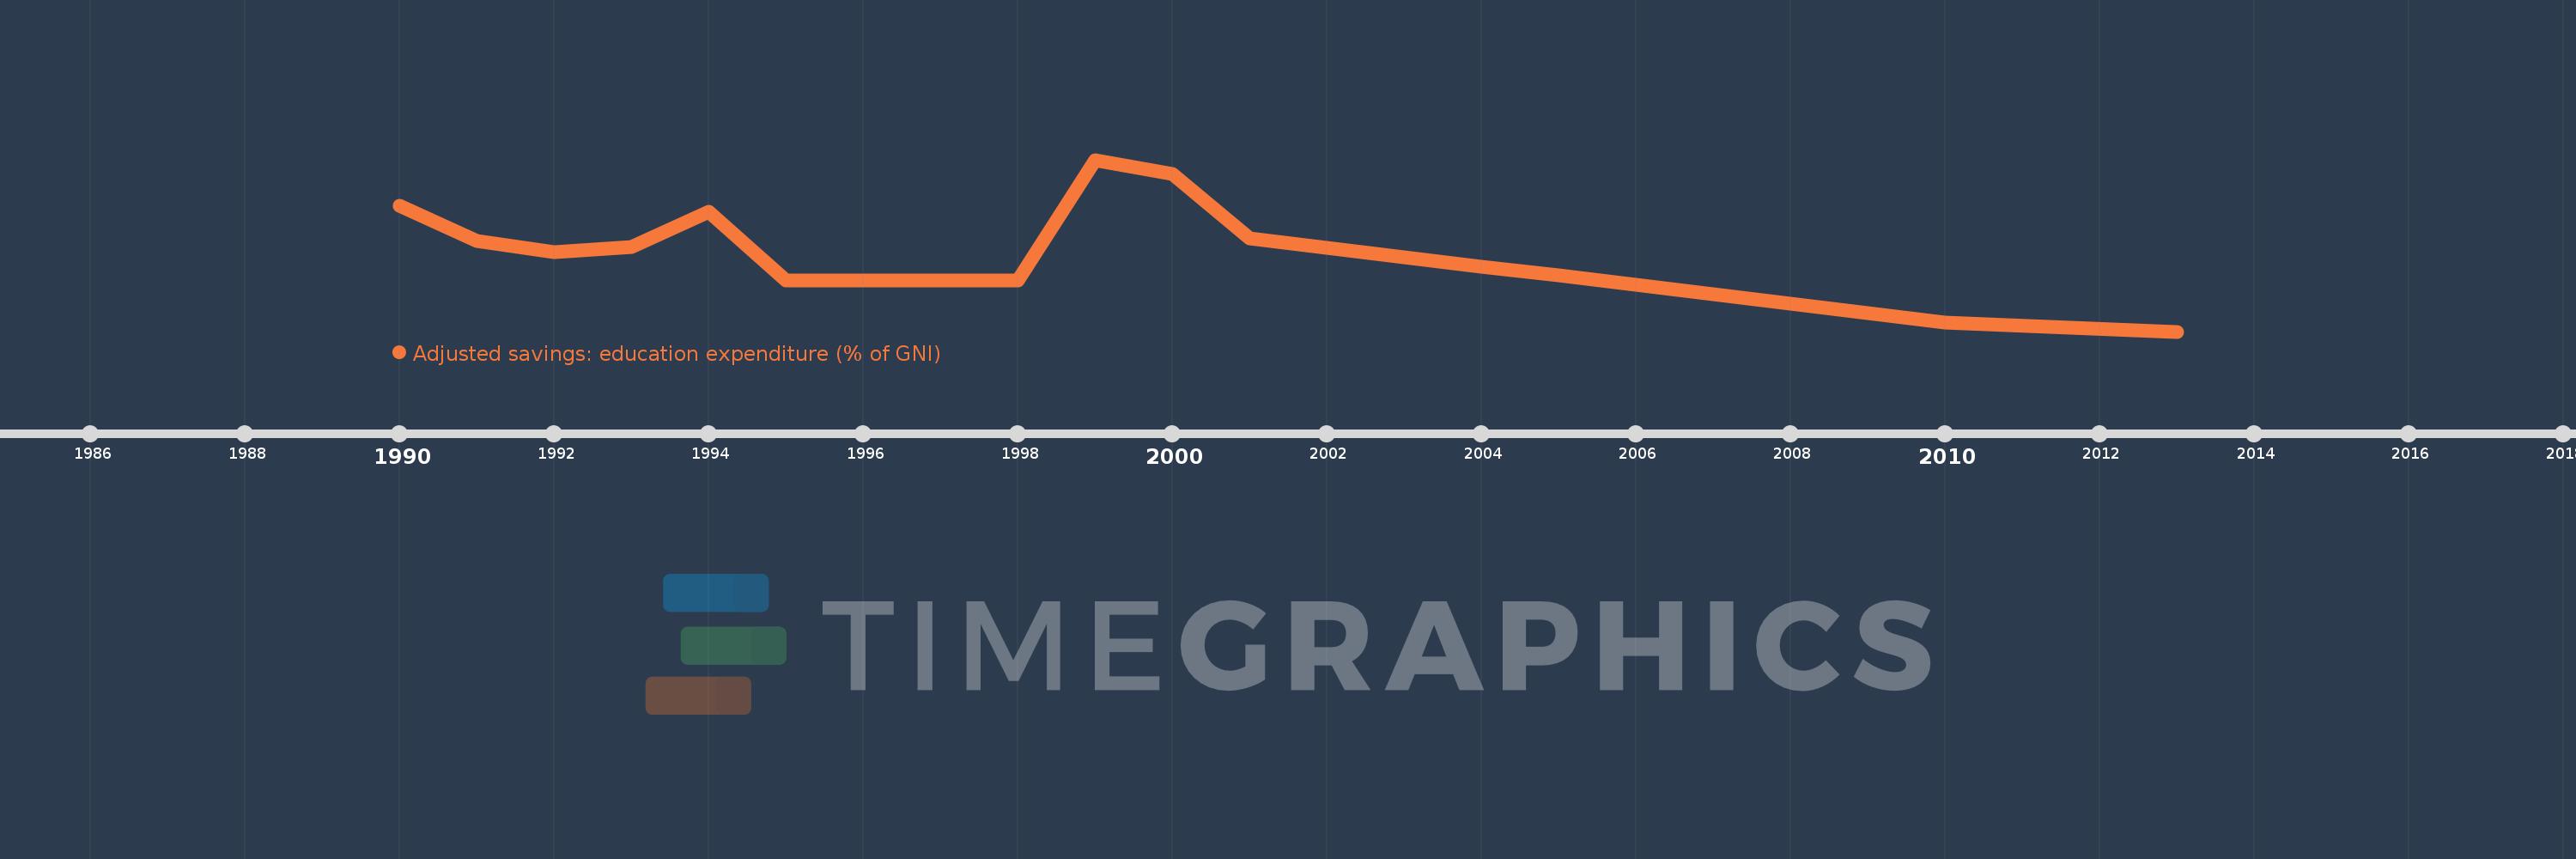
This timeline shows a graph from 1990 to 2013 of Brunei Darussalam. No data until 1989. Number of actual observations by date: 22.
Source name:
World Development Indicators
Source organization:
World Bank staff estimates using data from the United Nations Statistics Division's Statistical Yearbook, and the UNESCO Institute for Statistics online database.
Categories, topics:
Economy & Growth, Environment
Last updated:
apr 23, 2017
Indicators value changes by year
Meaning:
3.244
Minimum:
2.03
jan 1, 2013
Maximum:
5.0
jan 1, 1999
At the date of observation
Value
Absolute change
Change from the previous value
jan 1, 1990
4.2
+4.2
0.0%
jan 1, 1991
3.6
-0.6
-14.29%
jan 1, 1992
3.4
-0.2
-5.56%
jan 1, 1993
3.5
+0.1
2.94%
jan 1, 1994
4.1
+0.6
17.14%
jan 1, 1995
2.908
-1.192
-29.08%
jan 1, 1996
2.908
0.0
0.0%
jan 1, 1997
2.908
0.0
0.0%
jan 1, 1998
2.908
0.0
0.0%
jan 1, 1999
5.0
+2.092
71.96%
jan 1, 2000
4.76
-0.24
-4.8%
jan 1, 2001
3.64
-1.12
-23.53%
jan 1, 2002
3.479
-0.161
-4.42%
jan 1, 2003
3.318
-0.161
-4.63%
jan 1, 2004
3.157
-0.161
-4.85%
jan 1, 2005
2.996
-0.161
-5.1%
jan 1, 2006
2.835
-0.161
-5.37%
jan 1, 2007
2.674
-0.161
-5.68%
jan 1, 2008
2.513
-0.161
-6.02%
jan 1, 2009
2.352
-0.161
-6.41%
jan 1, 2010
2.191
-0.161
-6.85%
jan 1, 2013
2.03
-0.161
-7.35%
Ranking of countries by current statistics by years