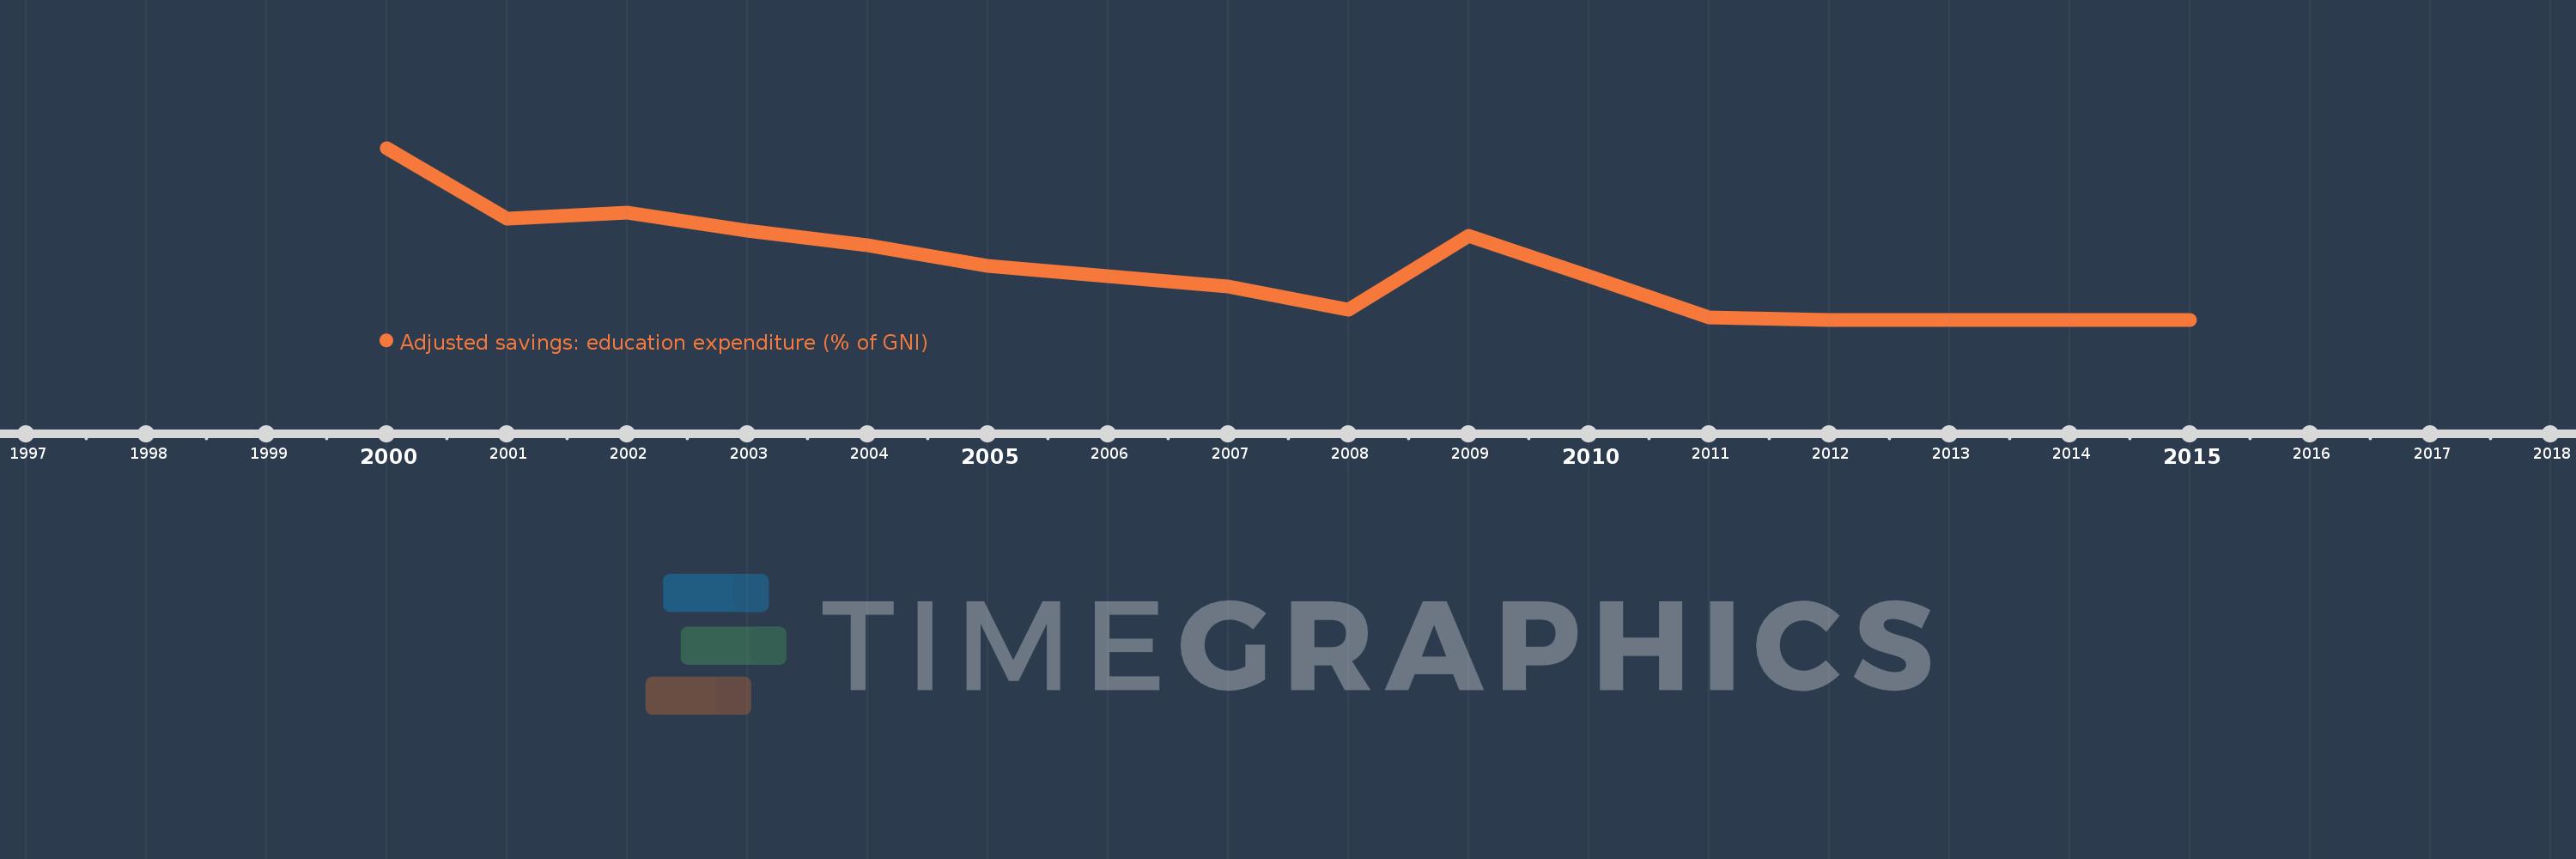
This timeline shows a graph from 2000 to 2015 of Latvia. No data until 1999. Number of actual observations by date: 16.
Source name:
World Development Indicators
Source organization:
World Bank staff estimates using data from the United Nations Statistics Division's Statistical Yearbook, and the UNESCO Institute for Statistics online database.
Categories, topics:
Economy & Growth, Environment
Last updated:
apr 23, 2017
Indicators value changes by year
Meaning:
4.691
Minimum:
4.329
jan 1, 2012
Maximum:
5.552
jan 1, 2000
At the date of observation
Value
Absolute change
Change from the previous value
jan 1, 2000
5.552
+5.552
0.0%
jan 1, 2001
5.05
-0.501
-9.03%
jan 1, 2002
5.09
+0.04
0.79%
jan 1, 2003
4.962
-0.128
-2.52%
jan 1, 2004
4.86
-0.102
-2.06%
jan 1, 2005
4.713
-0.147
-3.02%
jan 1, 2006
4.638
-0.075
-1.59%
jan 1, 2007
4.563
-0.075
-1.62%
jan 1, 2008
4.401
-0.162
-3.55%
jan 1, 2009
4.926
+0.525
11.92%
jan 1, 2010
4.636
-0.289
-5.88%
jan 1, 2011
4.346
-0.29
-6.26%
jan 1, 2012
4.329
-0.017
-0.39%
jan 1, 2013
4.329
0.0
0.0%
jan 1, 2014
4.329
0.0
0.0%
jan 1, 2015
4.329
0.0
0.0%
Ranking of countries by current statistics by years