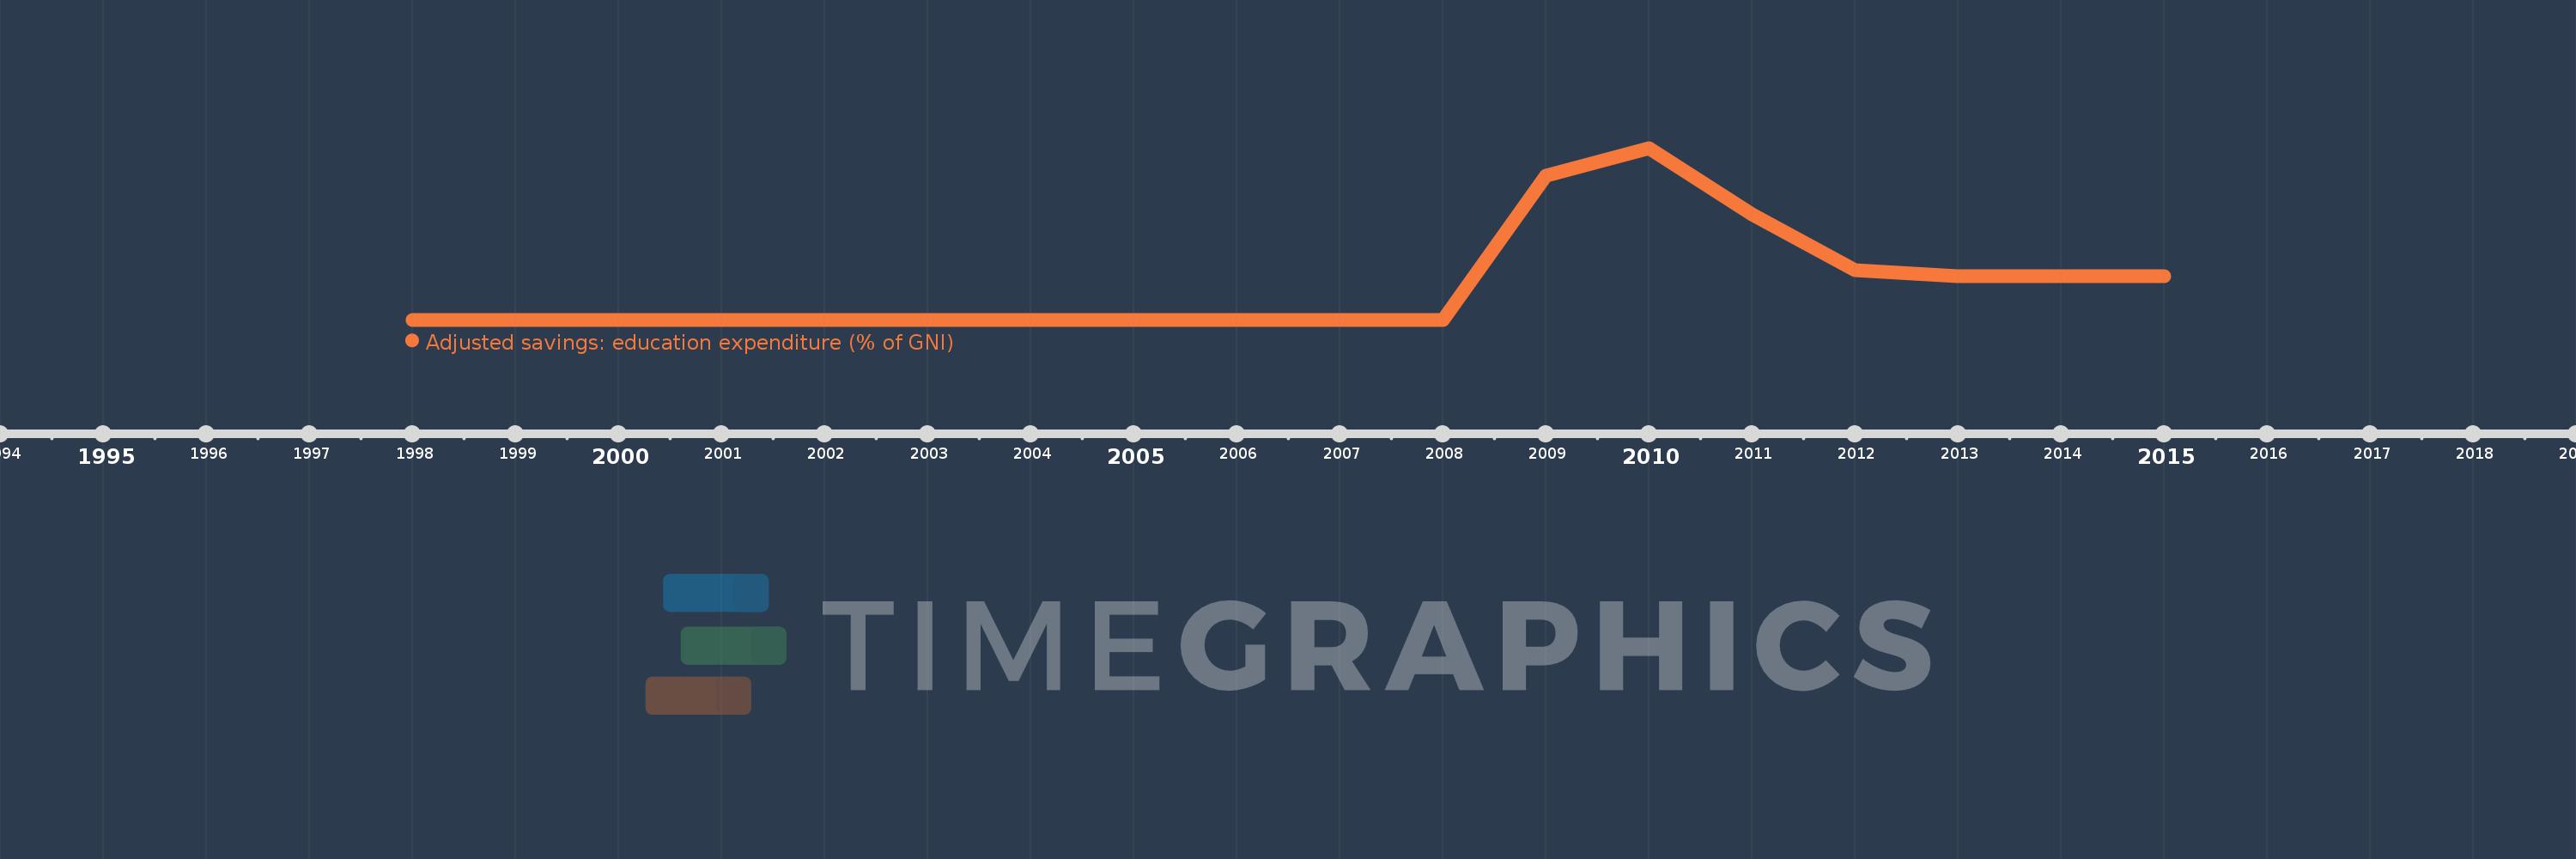
This timeline shows a graph from 1998 to 2015 of Serbia. No data until 1997. Number of actual observations by date: 18.
Source name:
World Development Indicators
Source organization:
World Bank staff estimates using data from the United Nations Statistics Division's Statistical Yearbook, and the UNESCO Institute for Statistics online database.
Categories, topics:
Economy & Growth, Environment
Last updated:
apr 23, 2017
Indicators value changes by year
Meaning:
4.45
Minimum:
4.39
jan 1, 1998
Maximum:
4.7
jan 1, 2010
At the date of observation
Value
Absolute change
Change from the previous value
jan 1, 1998
4.39
+4.39
0.0%
jan 1, 1999
4.39
0.0
0.0%
jan 1, 2000
4.39
0.0
0.0%
jan 1, 2001
4.39
0.0
0.0%
jan 1, 2002
4.39
0.0
0.0%
jan 1, 2003
4.39
0.0
0.0%
jan 1, 2004
4.39
0.0
0.0%
jan 1, 2005
4.39
0.0
0.0%
jan 1, 2006
4.39
0.0
0.0%
jan 1, 2007
4.39
0.0
0.0%
jan 1, 2008
4.39
0.0
0.0%
jan 1, 2009
4.65
+0.26
5.92%
jan 1, 2010
4.7
+0.05
1.08%
jan 1, 2011
4.58
-0.12
-2.55%
jan 1, 2012
4.48
-0.1
-2.18%
jan 1, 2013
4.469
-0.011
-0.25%
jan 1, 2014
4.469
0.0
0.0%
jan 1, 2015
4.469
0.0
0.0%
Ranking of countries by current statistics by years