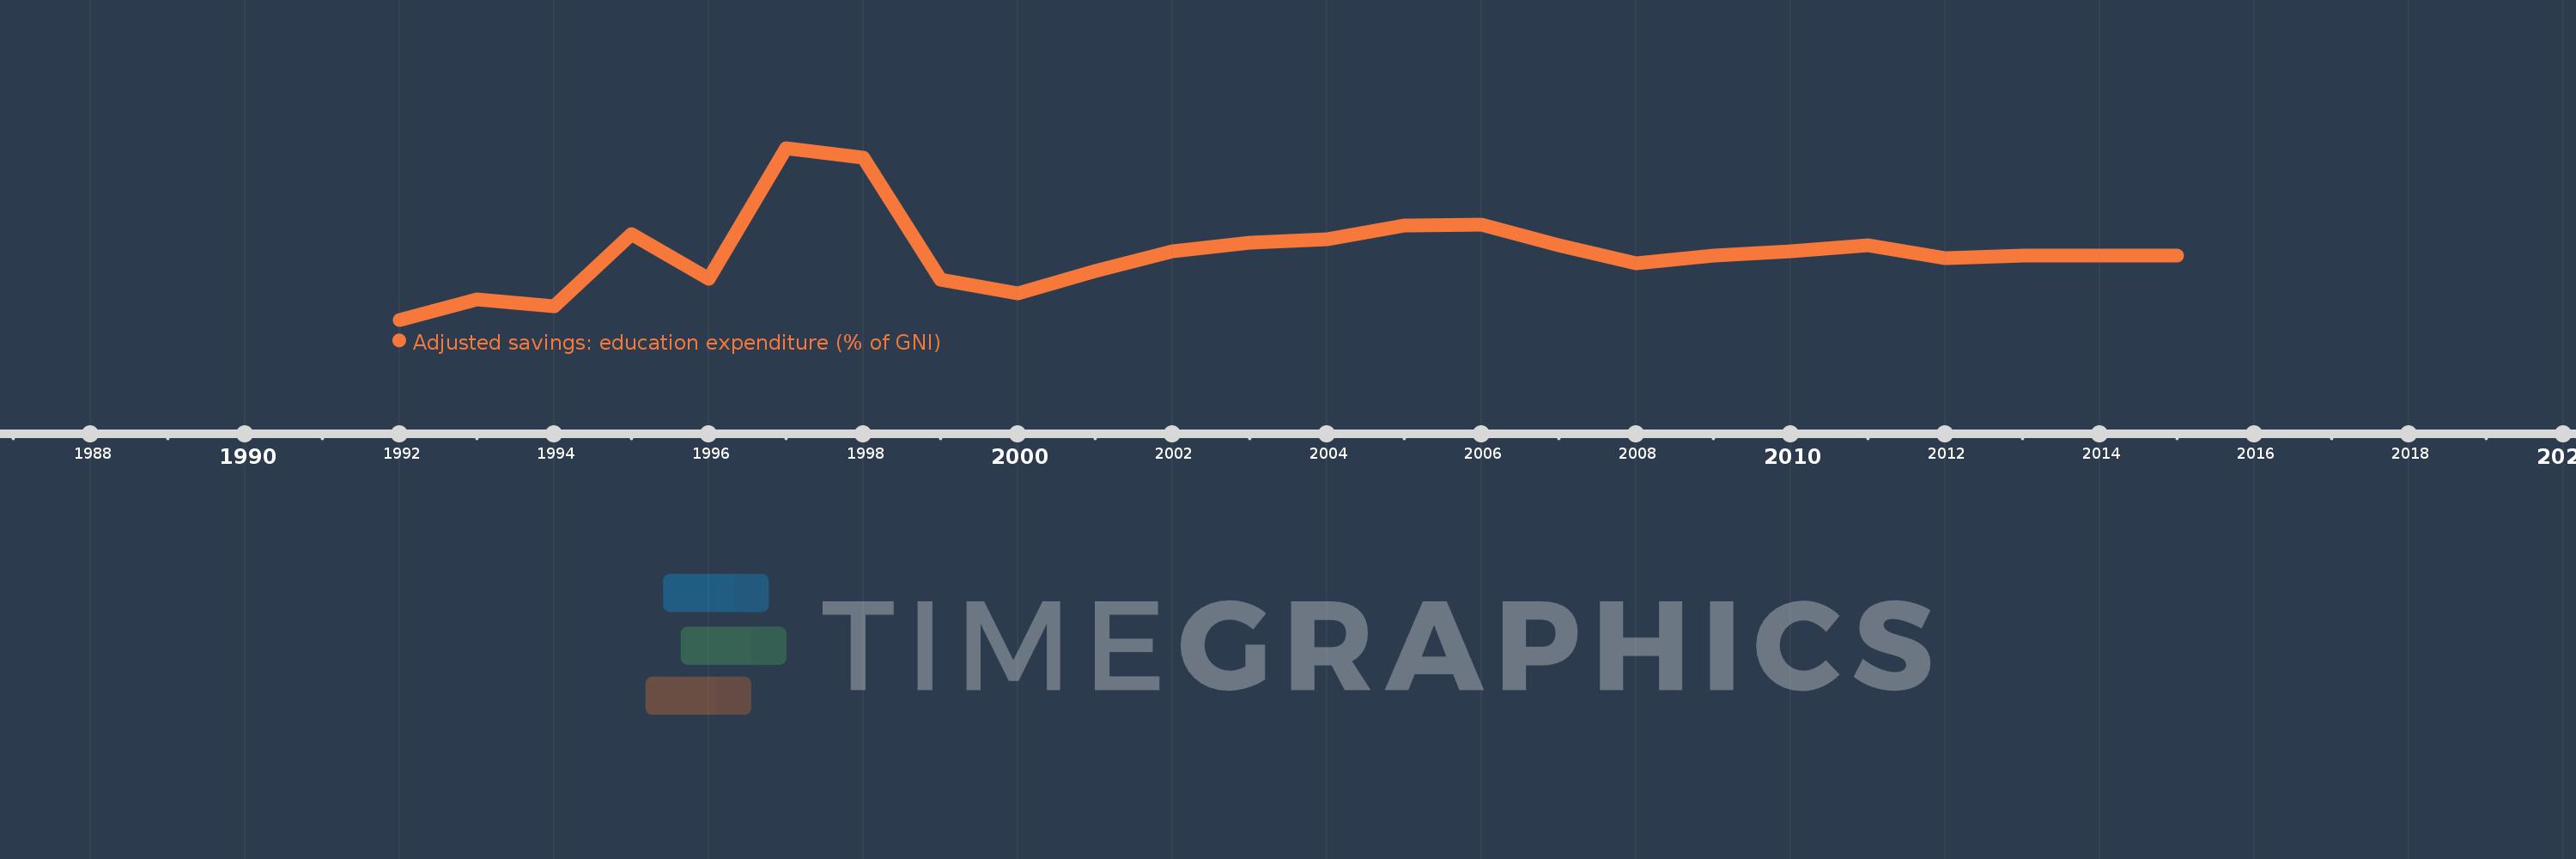
This timeline shows a graph from 1992 to 2015 of Poland. No data until 1991. Number of actual observations by date: 24.
Source name:
World Development Indicators
Source organization:
World Bank staff estimates using data from the United Nations Statistics Division's Statistical Yearbook, and the UNESCO Institute for Statistics online database.
Categories, topics:
Economy & Growth, Environment
Last updated:
apr 23, 2017
Indicators value changes by year
Meaning:
4.881
Minimum:
3.9
jan 1, 1992
Maximum:
6.4
jan 1, 1997
At the date of observation
Value
Absolute change
Change from the previous value
jan 1, 1992
3.9
+3.9
0.0%
jan 1, 1993
4.2
+0.3
7.69%
jan 1, 1994
4.1
-0.1
-2.38%
jan 1, 1995
5.146
+1.046
25.52%
jan 1, 1996
4.5
-0.646
-12.56%
jan 1, 1997
6.4
+1.9
42.22%
jan 1, 1998
6.26
-0.14
-2.19%
jan 1, 1999
4.489
-1.771
-28.29%
jan 1, 2000
4.28
-0.209
-4.66%
jan 1, 2001
4.608
+0.328
7.67%
jan 1, 2002
4.901
+0.293
6.36%
jan 1, 2003
5.02
+0.119
2.43%
jan 1, 2004
5.07
+0.05
1.0%
jan 1, 2005
5.27
+0.2
3.94%
jan 1, 2006
5.28
+0.01
0.19%
jan 1, 2007
4.99
-0.29
-5.49%
jan 1, 2008
4.72
-0.27
-5.41%
jan 1, 2009
4.84
+0.12
2.54%
jan 1, 2010
4.9
+0.06
1.24%
jan 1, 2011
4.99
+0.09
1.84%
jan 1, 2012
4.8
-0.19
-3.81%
jan 1, 2013
4.83
+0.03
0.63%
jan 1, 2014
4.83
0.0
0.0%
jan 1, 2015
4.83
0.0
0.0%
Ranking of countries by current statistics by years