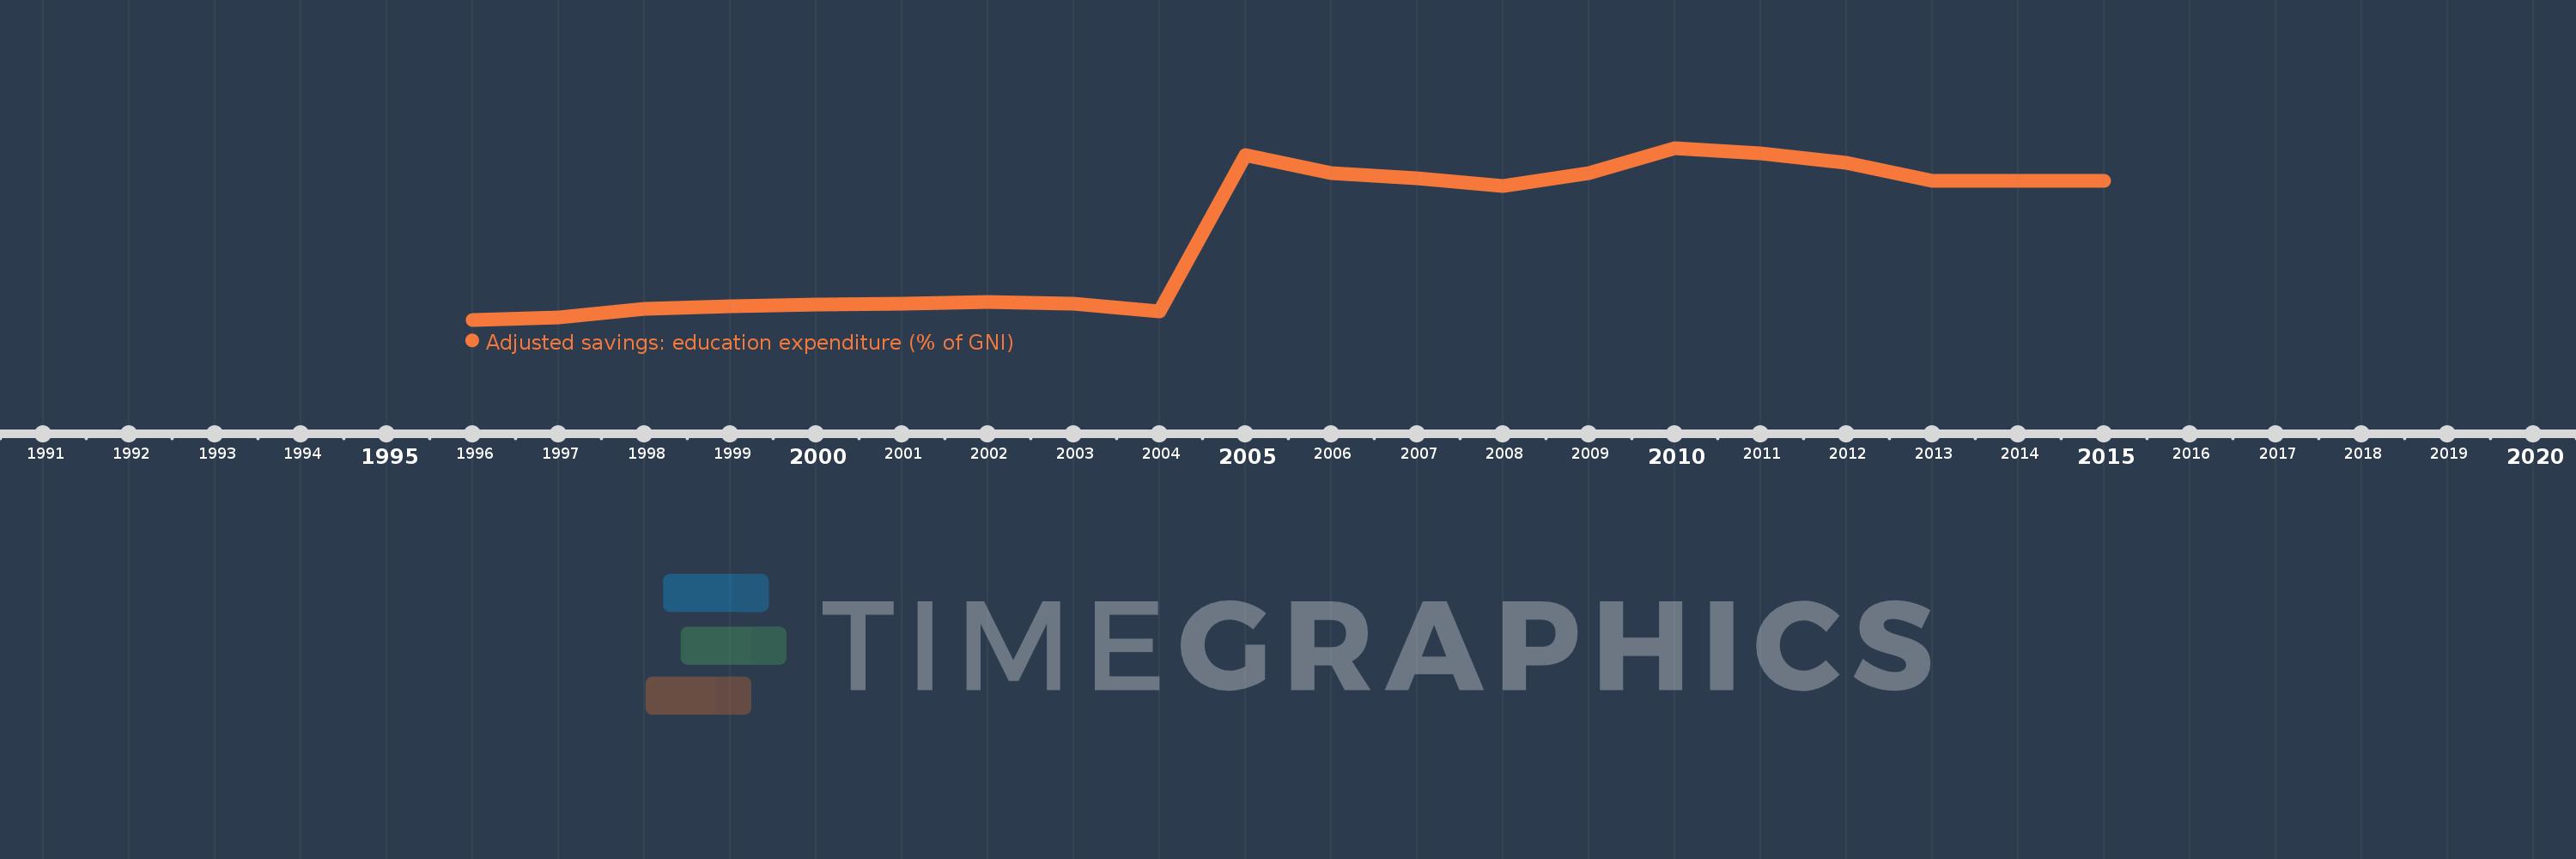
This timeline shows a graph from 1996 to 2015 of Lithuania. No data until 1995. Number of actual observations by date: 20.
Source name:
World Development Indicators
Source organization:
World Bank staff estimates using data from the United Nations Statistics Division's Statistical Yearbook, and the UNESCO Institute for Statistics online database.
Categories, topics:
Economy & Growth, Environment
Last updated:
apr 23, 2017
Indicators value changes by year
Meaning:
11.403
Minimum:
4.4
jan 1, 1996
Maximum:
18.19
jan 1, 2010
At the date of observation
Value
Absolute change
Change from the previous value
jan 1, 1996
4.4
+4.4
0.0%
jan 1, 1997
4.6
+0.2
4.55%
jan 1, 1998
5.3
+0.7
15.22%
jan 1, 1999
5.511
+0.211
3.98%
jan 1, 2000
5.607
+0.096
1.75%
jan 1, 2001
5.704
+0.096
1.72%
jan 1, 2002
5.8
+0.096
1.69%
jan 1, 2003
5.7
-0.1
-1.72%
jan 1, 2004
5.077
-0.623
-10.93%
jan 1, 2005
17.62
+12.543
247.07%
jan 1, 2006
16.16
-1.46
-8.29%
jan 1, 2007
15.76
-0.4
-2.48%
jan 1, 2008
15.12
-0.64
-4.06%
jan 1, 2009
16.18
+1.06
7.01%
jan 1, 2010
18.19
+2.01
12.42%
jan 1, 2011
17.79
-0.4
-2.2%
jan 1, 2012
16.98
-0.81
-4.55%
jan 1, 2013
15.52
-1.46
-8.6%
jan 1, 2014
15.52
0.0
0.0%
jan 1, 2015
15.52
0.0
0.0%
Ranking of countries by current statistics by years