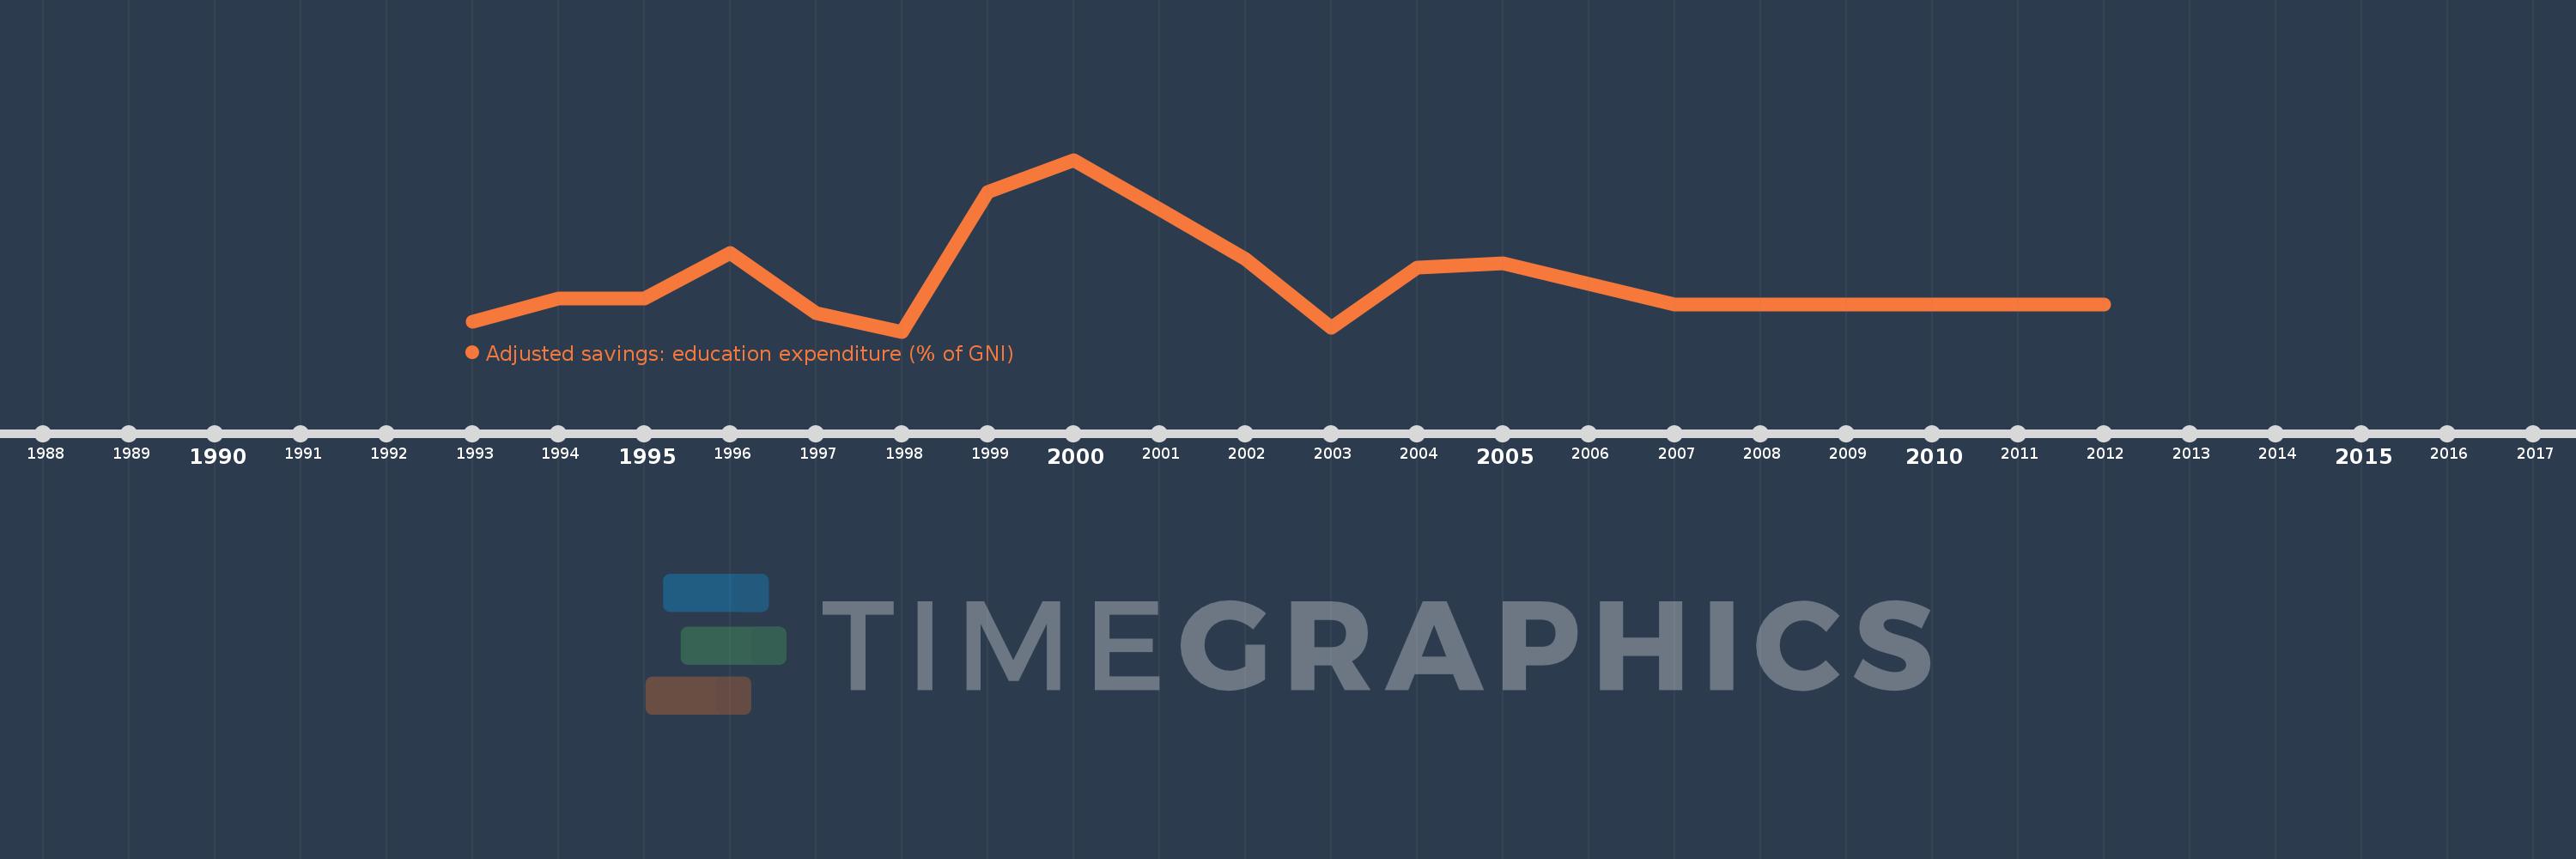
This timeline shows a graph from 1993 to 2012 of Eritrea. No data until 1992. Number of actual observations by date: 20.
Source name:
World Development Indicators
Source organization:
World Bank staff estimates using data from the United Nations Statistics Division's Statistical Yearbook, and the UNESCO Institute for Statistics online database.
Categories, topics:
Economy & Growth, Environment
Last updated:
apr 23, 2017
Indicators value changes by year
Meaning:
2.037
Minimum:
1.359
jan 1, 1998
Maximum:
3.63
jan 1, 2000
At the date of observation
Value
Absolute change
Change from the previous value
jan 1, 1993
1.491
+1.491
0.0%
jan 1, 1994
1.8
+0.309
20.75%
jan 1, 1995
1.8
0.0
0.0%
jan 1, 1996
2.4
+0.6
33.33%
jan 1, 1997
1.6
-0.8
-33.33%
jan 1, 1998
1.359
-0.241
-15.05%
jan 1, 1999
3.2
+1.841
135.43%
jan 1, 2000
3.63
+0.43
13.44%
jan 1, 2001
2.972
-0.658
-18.13%
jan 1, 2002
2.314
-0.658
-22.15%
jan 1, 2003
1.407
-0.907
-39.21%
jan 1, 2004
2.2
+0.793
56.41%
jan 1, 2005
2.26
+0.06
2.73%
jan 1, 2006
1.99
-0.27
-11.95%
jan 1, 2007
1.72
-0.27
-13.57%
jan 1, 2008
1.72
0.0
0.0%
jan 1, 2009
1.72
0.0
0.0%
jan 1, 2010
1.72
0.0
0.0%
jan 1, 2011
1.72
0.0
0.0%
jan 1, 2012
1.72
0.0
0.0%
Ranking of countries by current statistics by years