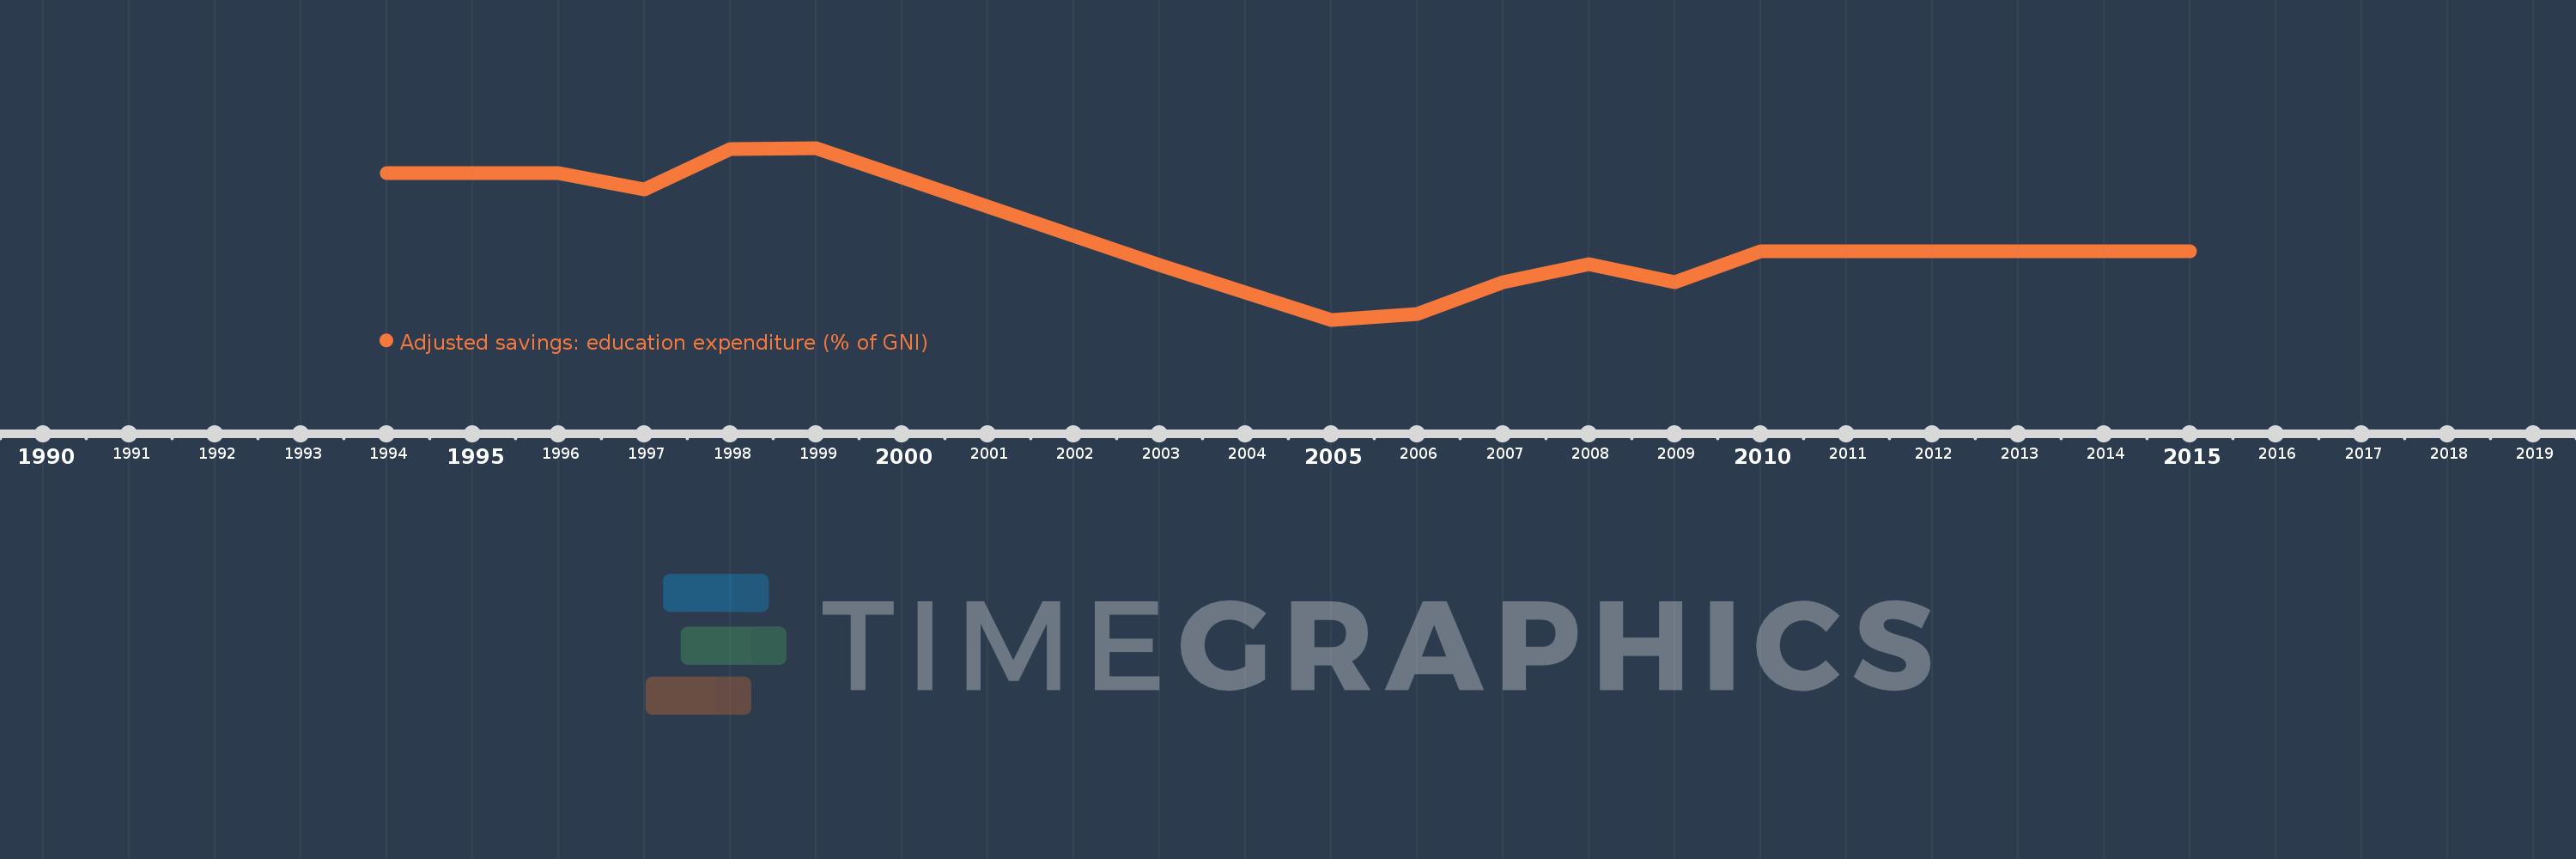
This timeline shows a graph from 1994 to 2015 of Kazakhstan. No data until 1993. Number of actual observations by date: 22.
Source name:
World Development Indicators
Source organization:
World Bank staff estimates using data from the United Nations Statistics Division's Statistical Yearbook, and the UNESCO Institute for Statistics online database.
Categories, topics:
Economy & Growth, Environment
Last updated:
apr 23, 2017
Indicators value changes by year
Meaning:
3.339
Minimum:
2.273
jan 1, 2005
Maximum:
4.413
jan 1, 1999
At the date of observation
Value
Absolute change
Change from the previous value
jan 1, 1994
4.1
+4.1
0.0%
jan 1, 1995
4.1
0.0
0.0%
jan 1, 1996
4.1
0.0
0.0%
jan 1, 1997
3.9
-0.2
-4.88%
jan 1, 1998
4.4
+0.5
12.82%
jan 1, 1999
4.413
+0.013
0.3%
jan 1, 2000
4.049
-0.365
-8.26%
jan 1, 2001
3.684
-0.365
-9.01%
jan 1, 2002
3.319
-0.365
-9.9%
jan 1, 2003
2.954
-0.365
-10.99%
jan 1, 2004
2.614
-0.341
-11.53%
jan 1, 2005
2.273
-0.341
-13.03%
jan 1, 2006
2.344
+0.071
3.11%
jan 1, 2007
2.738
+0.394
16.83%
jan 1, 2008
2.966
+0.228
8.31%
jan 1, 2009
2.738
-0.227
-7.67%
jan 1, 2010
3.128
+0.39
14.24%
jan 1, 2011
3.128
0.0
0.0%
jan 1, 2012
3.128
0.0
0.0%
jan 1, 2013
3.128
0.0
0.0%
jan 1, 2014
3.128
0.0
0.0%
jan 1, 2015
3.128
0.0
0.0%
Ranking of countries by current statistics by years