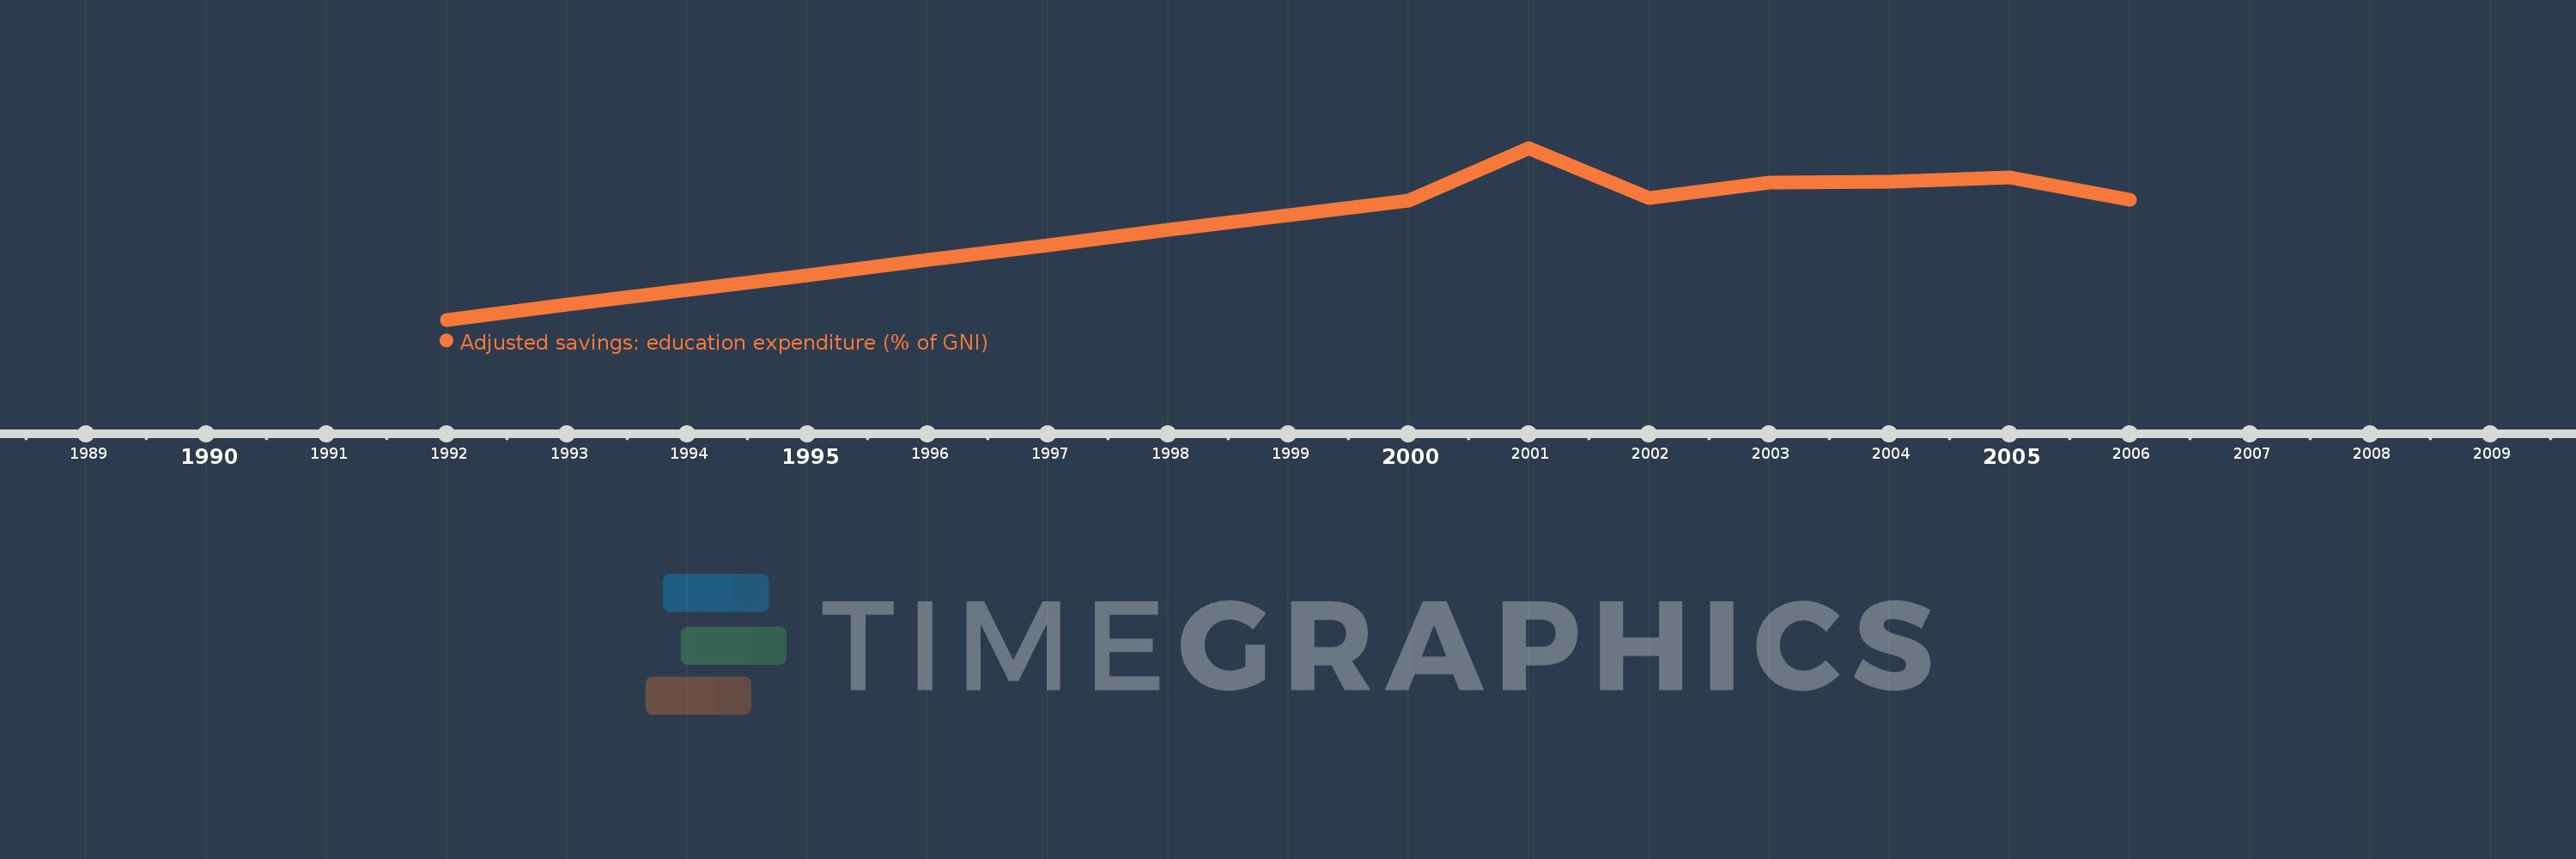
This timeline shows a graph from 1992 to 2006 of Djibouti. No data until 1991. Number of actual observations by date: 15.
Source name:
World Development Indicators
Source organization:
World Bank staff estimates using data from the United Nations Statistics Division's Statistical Yearbook, and the UNESCO Institute for Statistics online database.
Categories, topics:
Economy & Growth, Environment
Last updated:
apr 23, 2017
Indicators value changes by year
Meaning:
6.421
Minimum:
3.2
jan 1, 1992
Maximum:
9.265
jan 1, 2001
At the date of observation
Value
Absolute change
Change from the previous value
jan 1, 1992
3.2
+3.2
0.0%
jan 1, 1993
3.727
+0.527
16.46%
jan 1, 1994
4.254
+0.527
14.14%
jan 1, 1995
4.781
+0.527
12.39%
jan 1, 1996
5.307
+0.527
11.02%
jan 1, 1997
5.834
+0.527
9.93%
jan 1, 1998
6.361
+0.527
9.03%
jan 1, 1999
6.888
+0.527
8.28%
jan 1, 2000
7.415
+0.527
7.65%
jan 1, 2001
9.265
+1.851
24.96%
jan 1, 2002
7.512
-1.753
-18.92%
jan 1, 2003
8.043
+0.53
7.06%
jan 1, 2004
8.071
+0.029
0.35%
jan 1, 2005
8.221
+0.15
1.85%
jan 1, 2006
7.436
-0.785
-9.55%
Ranking of countries by current statistics by years