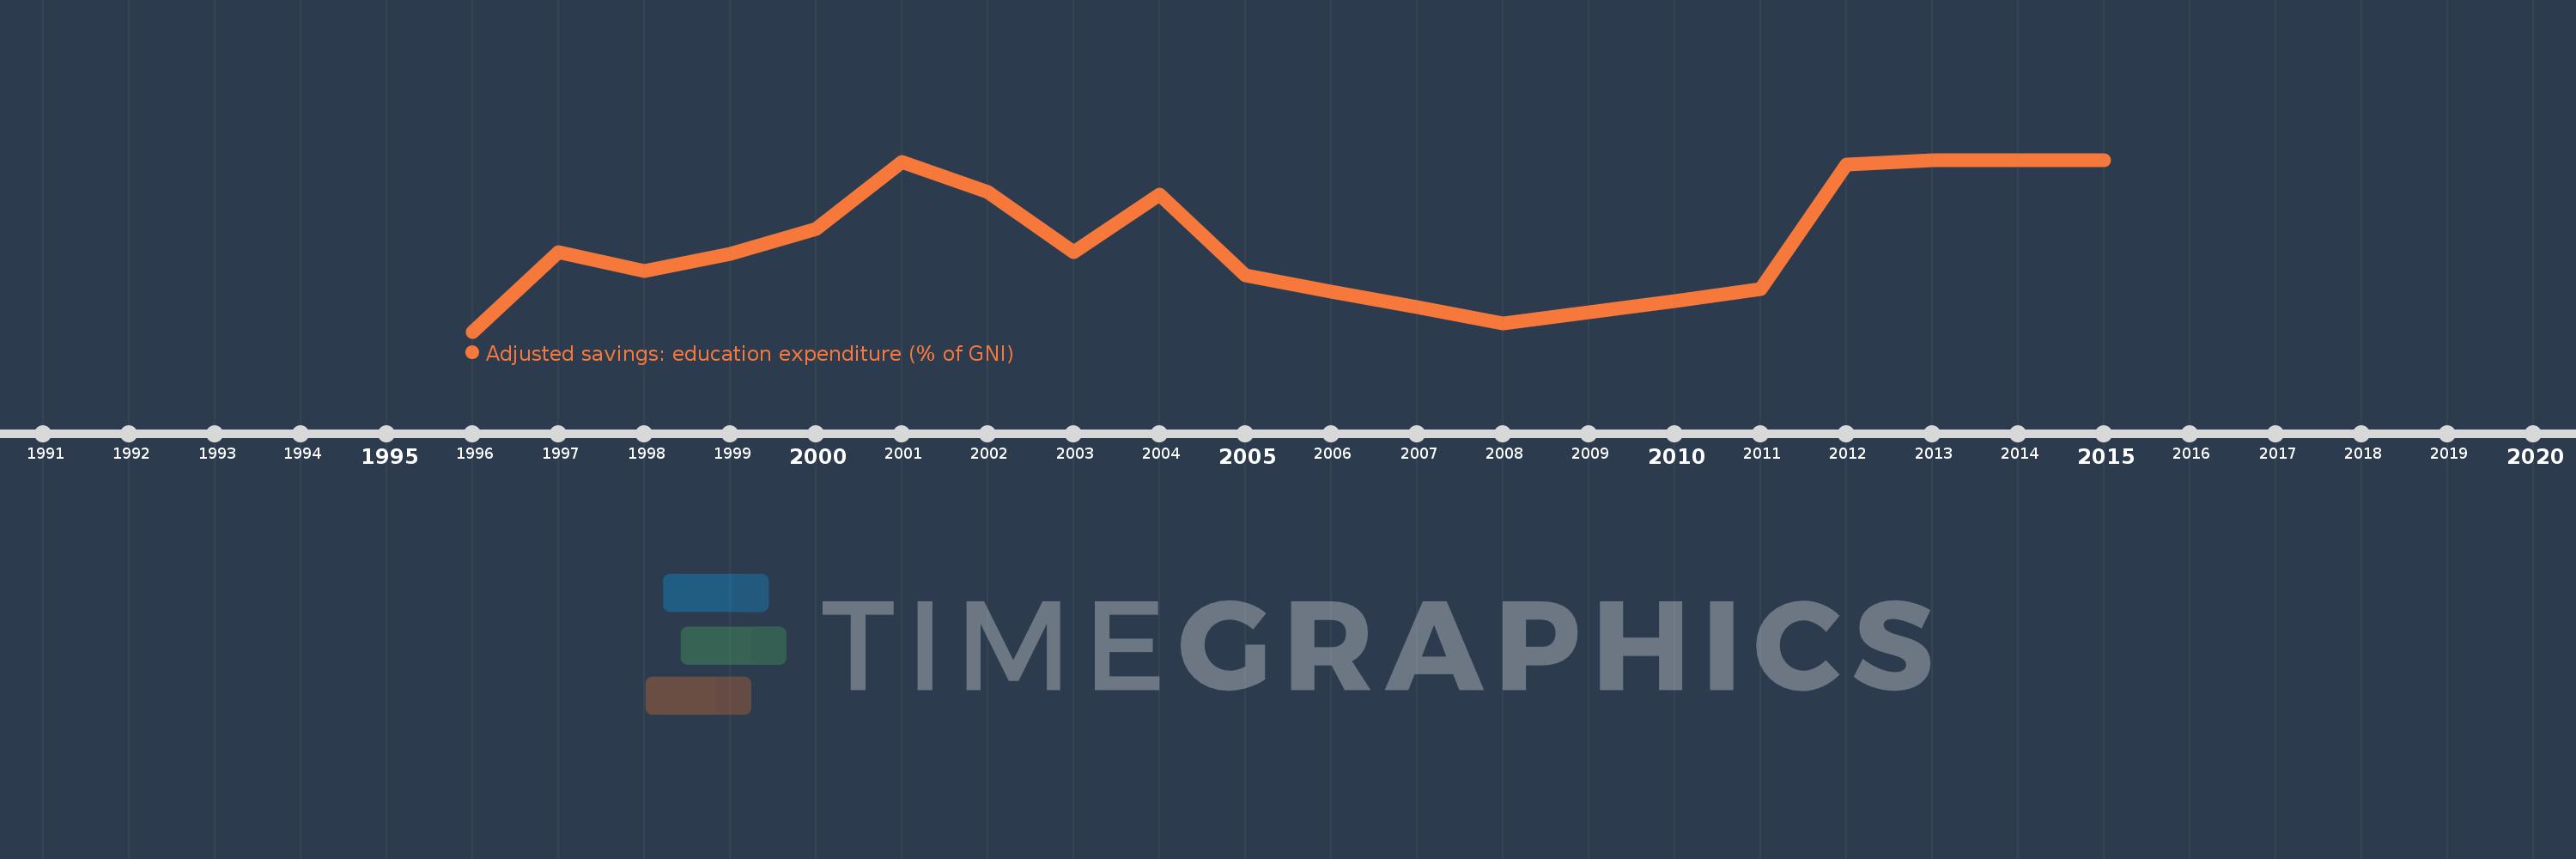
This timeline shows a graph from 1996 to 2015 of Paraguay. No data until 1995. Number of actual observations by date: 20.
Source name:
World Development Indicators
Source organization:
World Bank staff estimates using data from the United Nations Statistics Division's Statistical Yearbook, and the UNESCO Institute for Statistics online database.
Categories, topics:
Economy & Growth, Environment
Last updated:
apr 23, 2017
Indicators value changes by year
Meaning:
4.17
Minimum:
3.433
jan 1, 1996
Maximum:
4.88
jan 1, 2013
At the date of observation
Value
Absolute change
Change from the previous value
jan 1, 1996
3.433
+3.433
0.0%
jan 1, 1997
4.1
+0.667
19.43%
jan 1, 1998
3.942
-0.158
-3.86%
jan 1, 1999
4.089
+0.147
3.74%
jan 1, 2000
4.3
+0.211
5.16%
jan 1, 2001
4.86
+0.56
13.02%
jan 1, 2002
4.61
-0.25
-5.14%
jan 1, 2003
4.1
-0.51
-11.06%
jan 1, 2004
4.59
+0.49
11.95%
jan 1, 2005
3.91
-0.68
-14.81%
jan 1, 2006
3.773
-0.137
-3.5%
jan 1, 2007
3.637
-0.137
-3.62%
jan 1, 2008
3.5
-0.137
-3.76%
jan 1, 2009
3.597
+0.097
2.76%
jan 1, 2010
3.693
+0.097
2.69%
jan 1, 2011
3.79
+0.097
2.62%
jan 1, 2012
4.84
+1.05
27.7%
jan 1, 2013
4.88
+0.04
0.83%
jan 1, 2014
4.88
0.0
0.0%
jan 1, 2015
4.88
0.0
0.0%
Ranking of countries by current statistics by years