Download This statistics in other country:
Timeline:
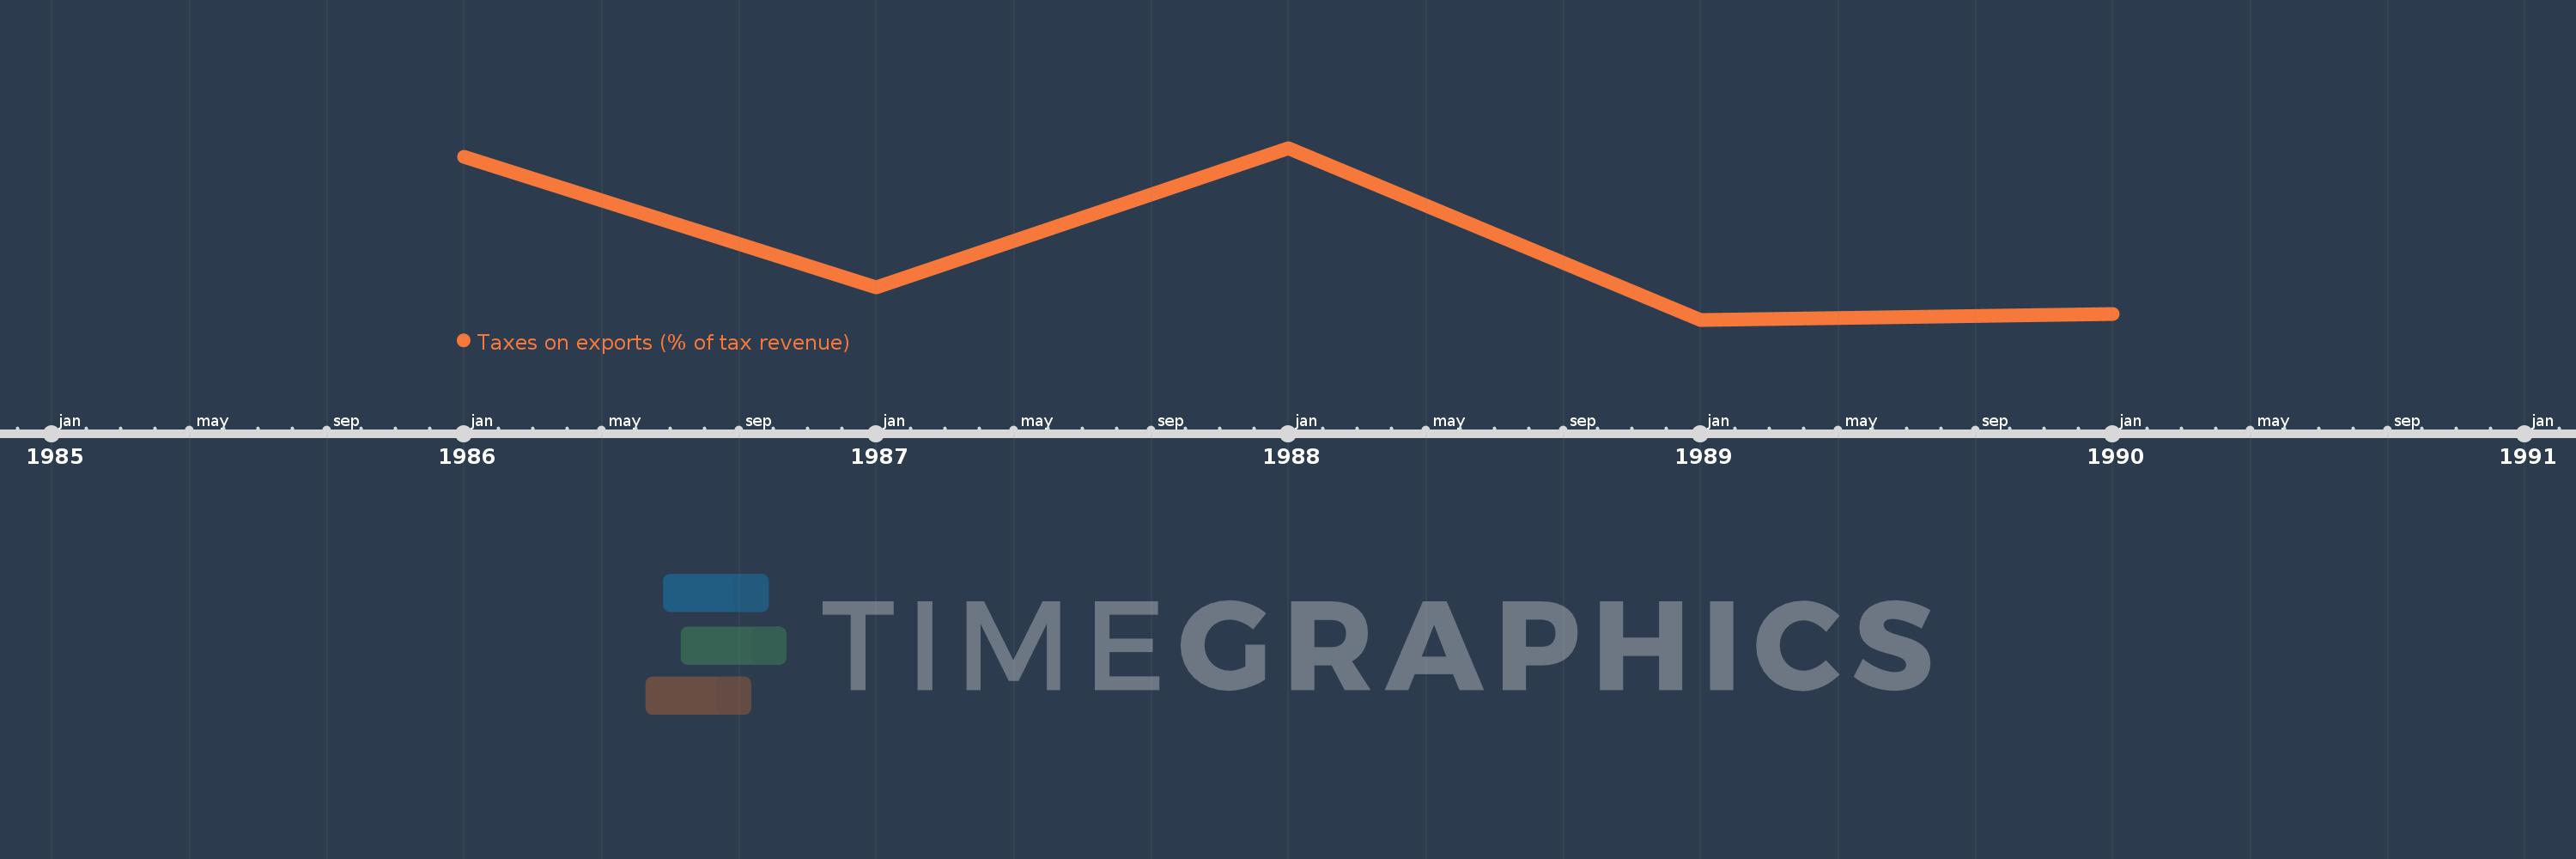
This timeline shows a graph from 1986 to 1990 of Bolivia. No data until 1985. Number of actual observations by date: 5.
Source name:
World Development Indicators
Source organization:
International Monetary Fund, Government Finance Statistics Yearbook and data files.
Categories, topics:
Public Sector, Trade
Last updated:
apr 23, 2017
Indicators value changes by year
At the date of observation
Value
Absolute change
Change from the previous value
jan 1, 1986
5.834
+5.834
0.0%
jan 1, 1987
1.868
-3.966
-67.98%
jan 1, 1988
6.111
+4.243
227.15%
jan 1, 1989
0.89
-5.221
-85.44%
jan 1, 1990
1.066
+0.176
19.8%
Ranking of countries by current statistics by years