Download This statistics in other country:
Timeline:
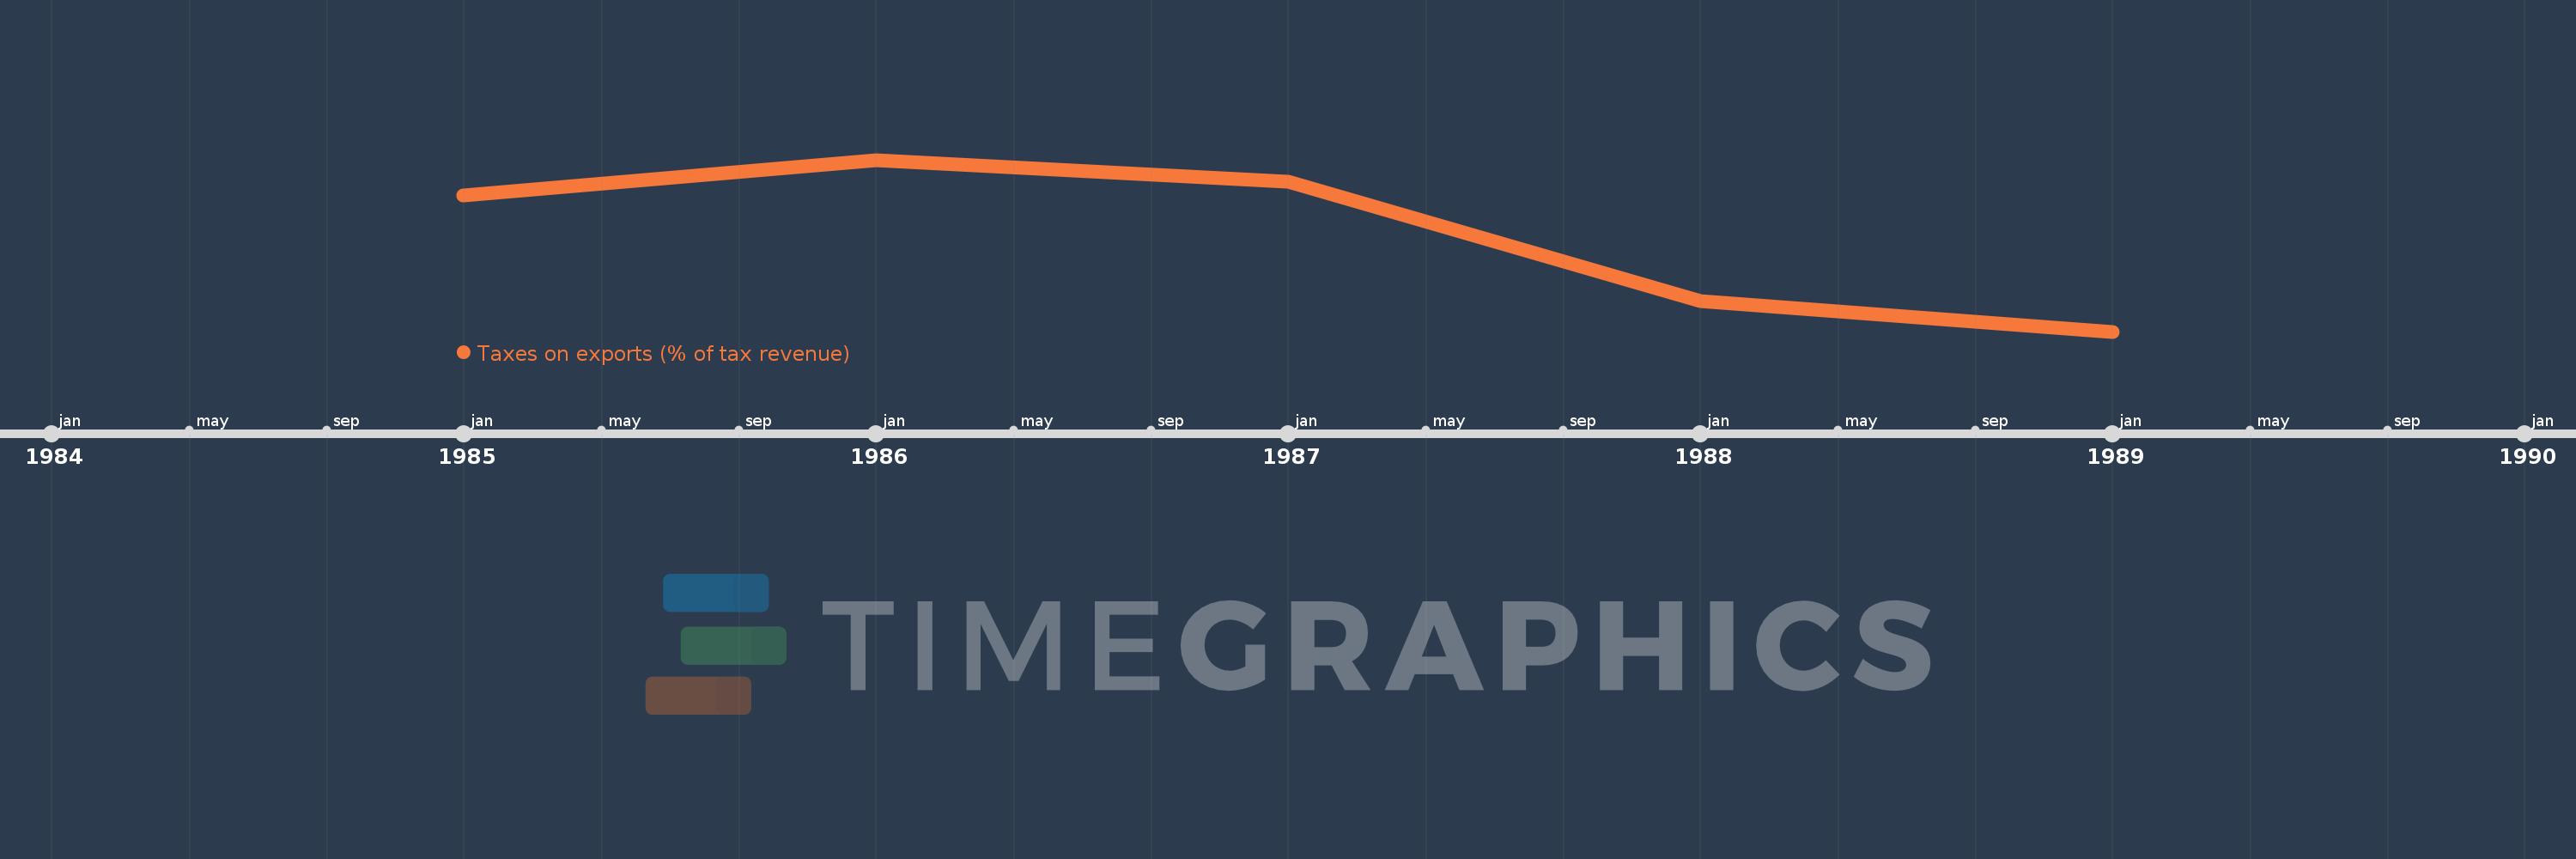
This timeline shows a graph from 1985 to 1989 of Poland. No data until 1984. Number of actual observations by date: 5.
Source name:
World Development Indicators
Source organization:
International Monetary Fund, Government Finance Statistics Yearbook and data files.
Categories, topics:
Public Sector, Trade
Last updated:
apr 23, 2017
Indicators value changes by year
At the date of observation
Value
Absolute change
Change from the previous value
jan 1, 1985
2.574
+2.574
0.0%
jan 1, 1986
3.148
+0.574
22.31%
jan 1, 1987
2.793
-0.355
-11.28%
jan 1, 1988
0.899
-1.894
-67.82%
jan 1, 1989
0.413
-0.485
-54.02%
Ranking of countries by current statistics by years