33
/
AIzaSyB4mHJ5NPEv-XzF7P6NDYXjlkCWaeKw5bc
November 30, 2025
166910
Kazakhstan
KAZ
true
2
1
Taxes on exports (% of tax revenue)
2016,2015,2014,2013,2012,2011,2005,2004,2003,2002,2001,1998
Create a timeline
Public Timelines
For education
For educational institutions
For teachers
For students
Cabinet
For educational institutions
For teachers
For students
Open cabinet
FAQ
Close
Create a timeline
Public timelines
FAQ
About & Feedback
Terms
Privacy
FAQ
Support 24/7
Cabinet
Get premium
Donate
Download
Global statistics library
→
Kazakhstan
→
Taxes on exports (% of tax revenue)
This statistics in other country:
Afghanistan
Albania
Algeria
Angola
Argentina
Australia
Austria
Azerbaijan
Bahamas, The
Bangladesh
Barbados
Belarus
Belize
Benin
Bhutan
Bolivia
Bosnia and Herzegovina
Botswana
Brazil
Bulgaria
Burundi
Cambodia
Central African Republic
Congo, Dem. Rep.
Congo, Rep.
Costa Rica
Cote d'Ivoire
Cyprus
Dominican Republic
Egypt, Arab Rep.
El Salvador
Equatorial Guinea
Ethiopia
Fiji
Finland
Gambia, The
Ghana
Greece
Grenada
Guatemala
Honduras
Hungary
Iceland
India
Indonesia
Iran, Islamic Rep.
Iraq
Jamaica
Kazakhstan
Kenya
Kyrgyz Republic
Lao PDR
Latvia
Lesotho
Liberia
Lithuania
Macedonia, FYR
Madagascar
Malaysia
Maldives
Mali
Malta
Mauritius
Mexico
Mongolia
Morocco
Namibia
Nepal
New Zealand
Nicaragua
Norway
Pakistan
Panama
Papua New Guinea
Peru
Poland
Portugal
Russian Federation
Rwanda
Sao Tome and Principe
Sierra Leone
Solomon Islands
South Africa
Sri Lanka
St. Kitts and Nevis
Suriname
Swaziland
Syrian Arab Republic
Tajikistan
Tanzania
Thailand
Togo
Tunisia
Uganda
Ukraine
United Kingdom
Uruguay
Vanuatu
Zambia
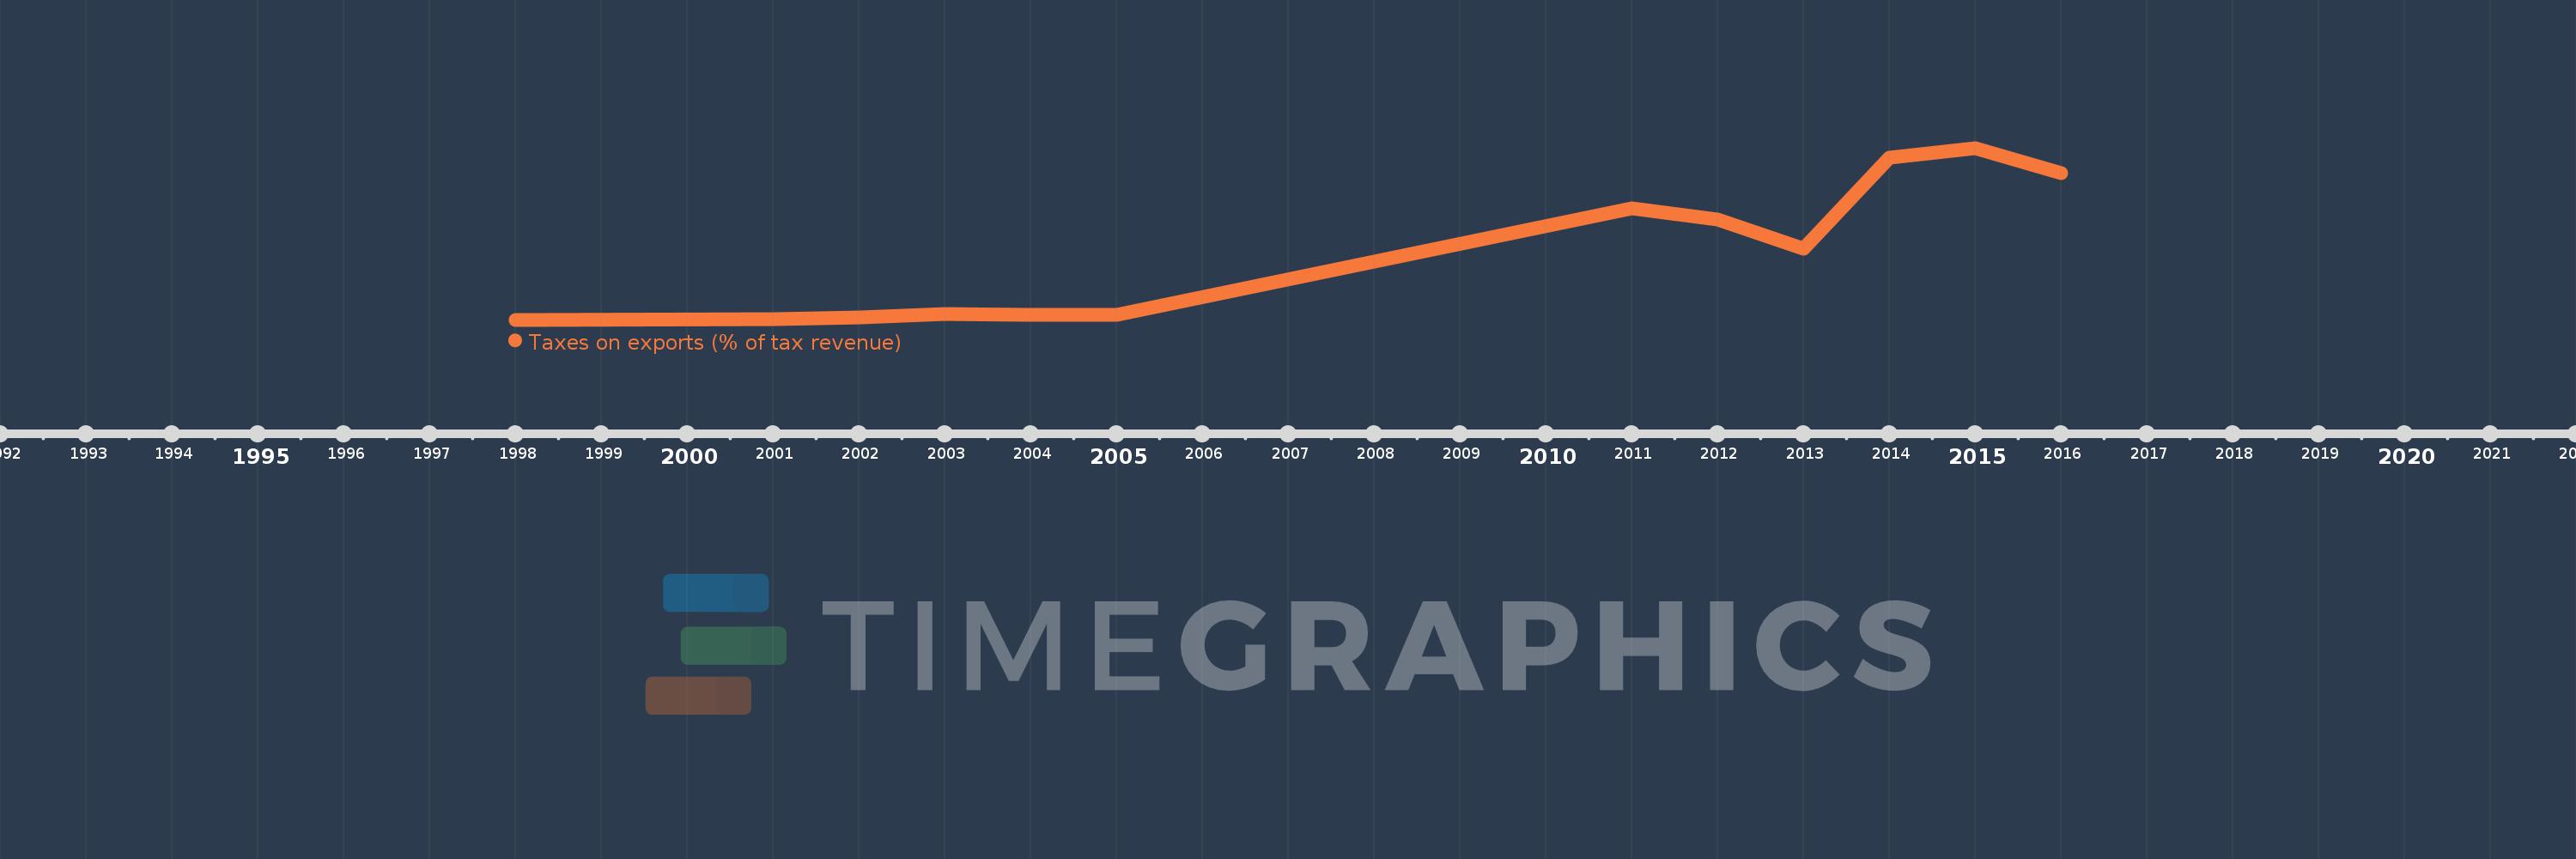
Timeline:
This timeline shows a graph from
1998
to
2016
of Kazakhstan. No data until
1997
. Number of actual observations by date:
12
.
Source name:
World Development Indicators
Source organization:
International Monetary Fund, Government Finance Statistics Yearbook and data files.
Categories, topics:
Public Sector, Trade
Last updated:
apr 23, 2017
Indicators value changes by year
Meaning:
10.177
Minimum:
0.002
jan 1, 1998
Maximum:
26.885
jan 1, 2015
At the date of observation
Value
Absolute change
Change from the previous value
jan 1, 1998
0.002
+0.002
0.0%
jan 1, 2001
0.045
+0.044
2.48K%
jan 1, 2002
0.342
+0.297
653.88%
jan 1, 2003
0.848
+0.505
147.57%
jan 1, 2004
0.735
-0.113
-13.34%
jan 1, 2005
0.731
-0.004
-0.53%
jan 1, 2011
17.455
+16.724
2.29K%
jan 1, 2012
15.691
-1.764
-10.11%
jan 1, 2013
11.085
-4.606
-29.36%
jan 1, 2014
25.418
+14.333
129.31%
jan 1, 2015
26.885
+1.467
5.77%
jan 1, 2016
22.893
-3.992
-14.85%
Ranking of countries by current statistics by years
About & Feedback
Terms
Privacy
FAQ
Support 24/7
Cabinet
Get premium
Donate
The service accepts bank transfer (ACH, Wire) or cards (Visa, MasterCard, etc). Processed by Stripe.
Secured with SSL