Download This statistics in other country:
Timeline:
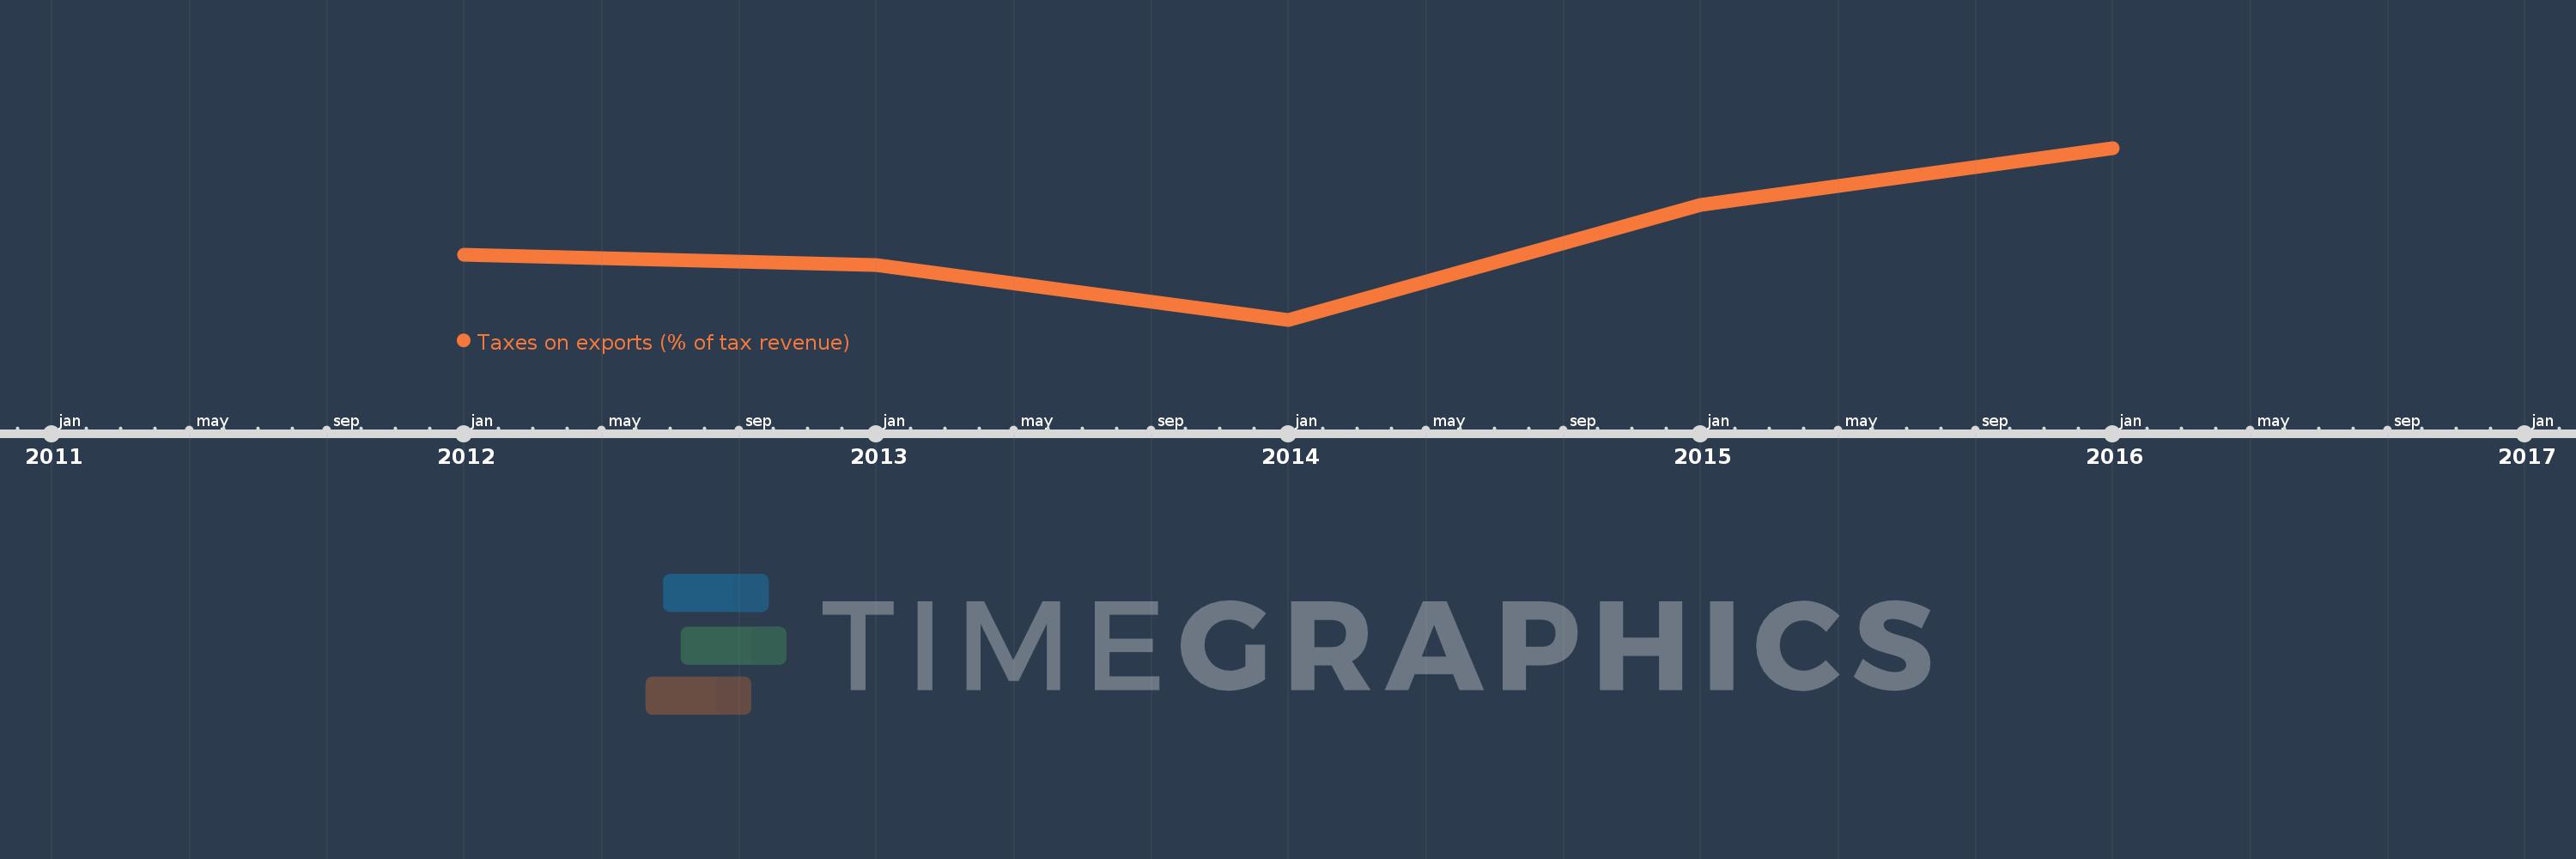
This timeline shows a graph from 2012 to 2016 of Solomon Islands. No data until 2011. Number of actual observations by date: 5.
Source name:
World Development Indicators
Source organization:
International Monetary Fund, Government Finance Statistics Yearbook and data files.
Categories, topics:
Public Sector, Trade
Last updated:
apr 23, 2017
Indicators value changes by year
Minimum:
17.025
jan 1, 2014
Maximum:
21.043
jan 1, 2016
At the date of observation
Value
Absolute change
Change from the previous value
jan 1, 2012
18.549
+18.549
0.0%
jan 1, 2013
18.301
-0.248
-1.34%
jan 1, 2014
17.025
-1.276
-6.97%
jan 1, 2015
19.717
+2.692
15.81%
jan 1, 2016
21.043
+1.326
6.72%
Ranking of countries by current statistics by years