Download This statistics in other country:
Timeline:
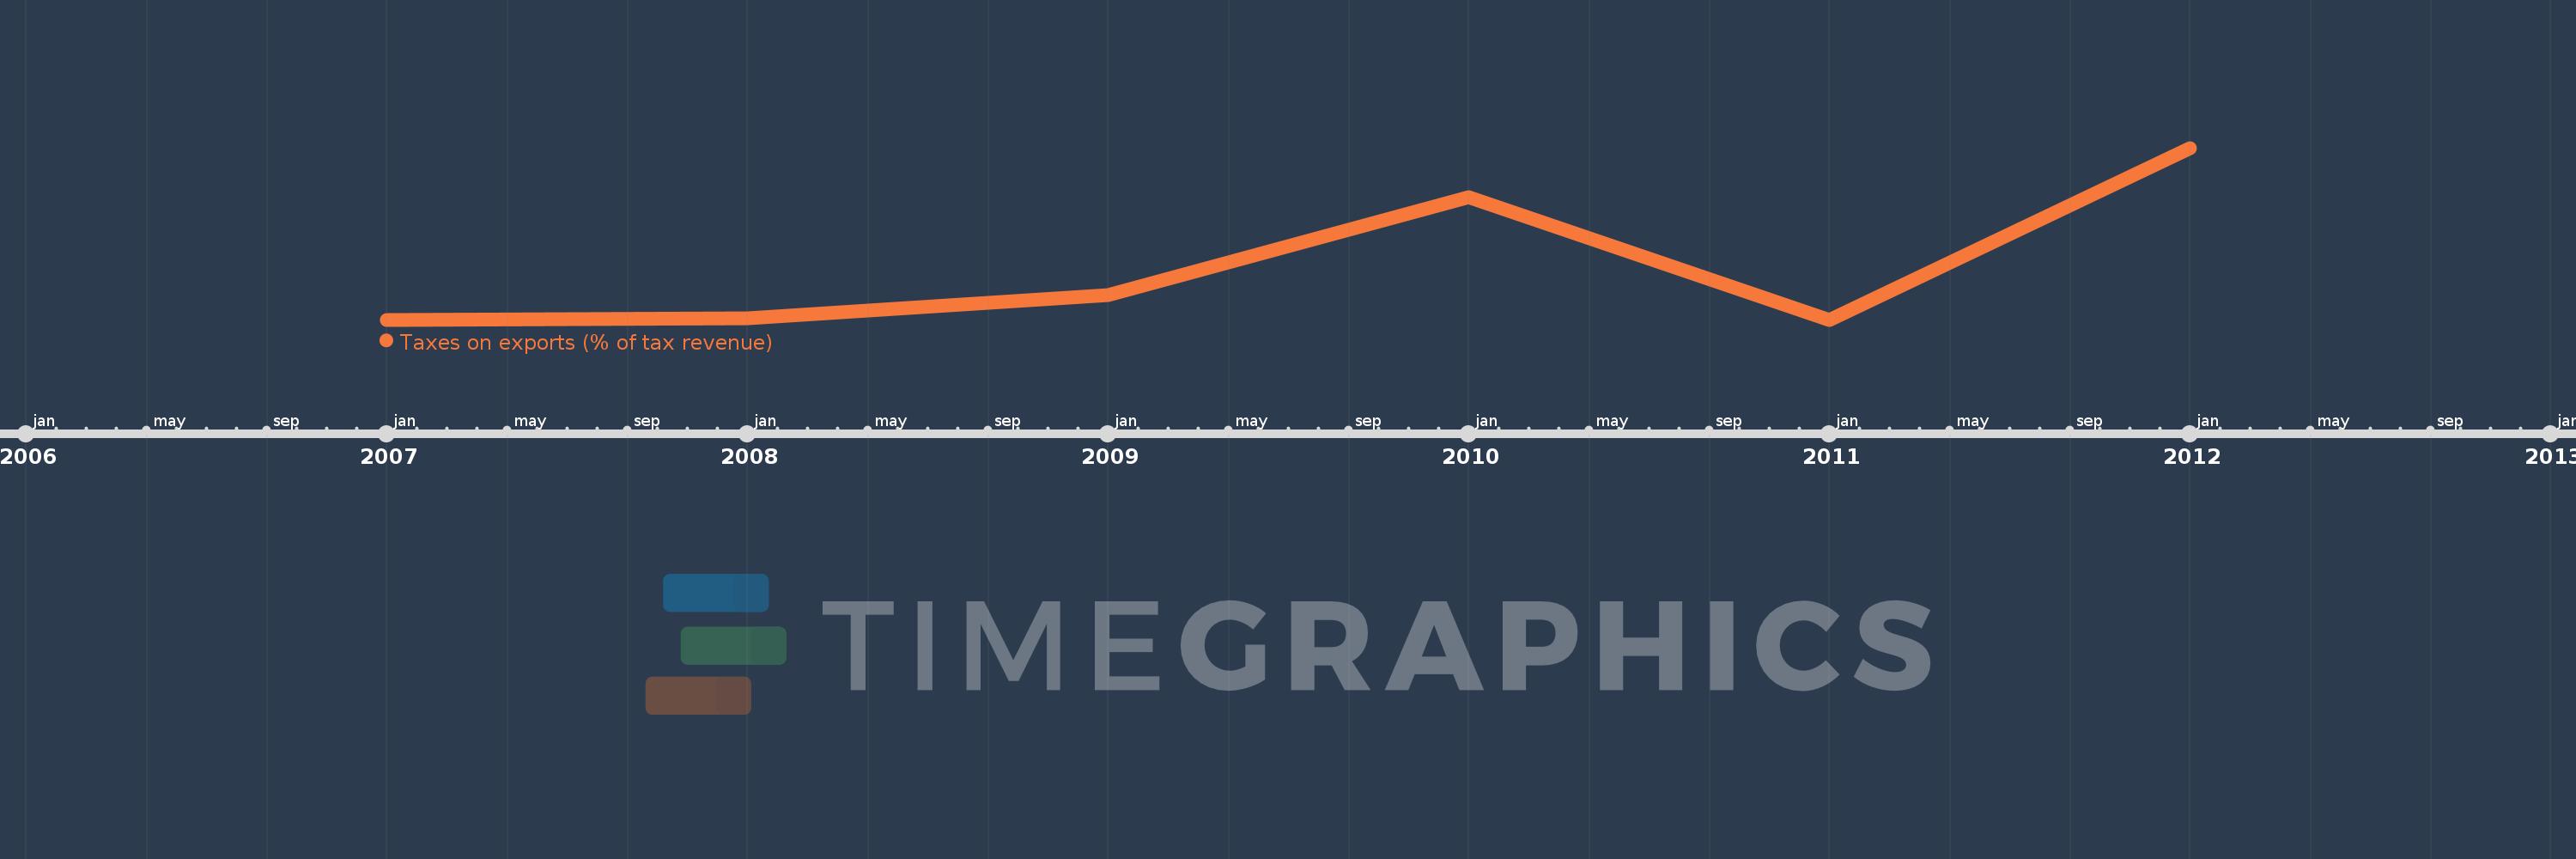
This timeline shows a graph from 2007 to 2012 of Algeria. No data until 2006. Number of actual observations by date: 6.
Source name:
World Development Indicators
Source organization:
International Monetary Fund, Government Finance Statistics Yearbook and data files.
Categories, topics:
Public Sector, Trade
Last updated:
apr 23, 2017
Indicators value changes by year
At the date of observation
Value
Absolute change
Change from the previous value
jan 1, 2007
0.001
+0.001
0.0%
jan 1, 2008
0.002
+0.002
295.84%
jan 1, 2009
0.015
+0.013
574.24%
jan 1, 2010
0.071
+0.056
362.02%
jan 1, 2011
0.001
-0.07
-98.98%
jan 1, 2012
0.099
+0.099
13.58K%
Ranking of countries by current statistics by years