Download This statistics in other country:
Timeline:
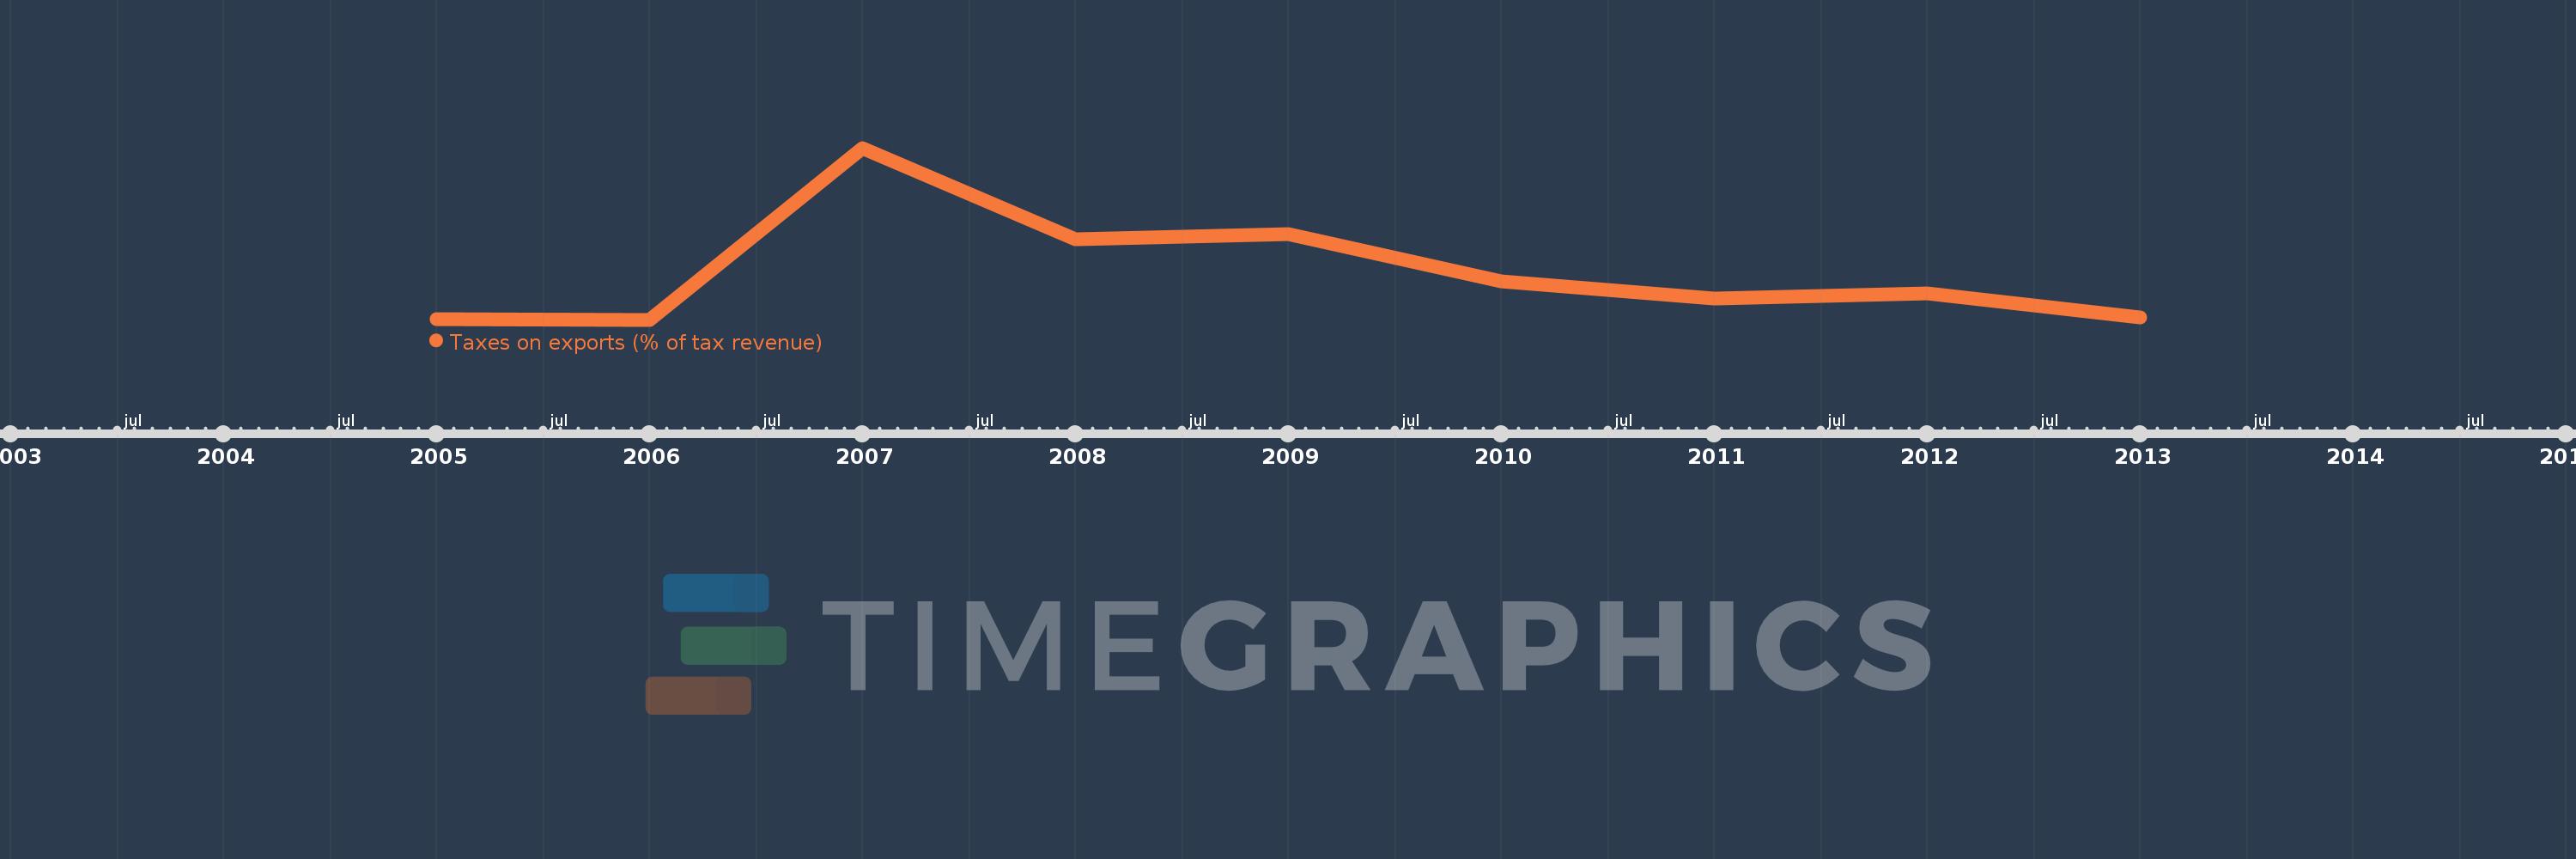
This timeline shows a graph from 2005 to 2013 of Congo, Rep.. No data until 2004. Number of actual observations by date: 9.
Source name:
World Development Indicators
Source organization:
International Monetary Fund, Government Finance Statistics Yearbook and data files.
Categories, topics:
Public Sector, Trade
Last updated:
apr 23, 2017
Indicators value changes by year
At the date of observation
Value
Absolute change
Change from the previous value
jan 1, 2005
0.05
+0.05
0.0%
jan 1, 2006
0.045
-0.005
-9.98%
jan 1, 2007
0.897
+0.852
1.88K%
jan 1, 2008
0.446
-0.451
-50.31%
jan 1, 2009
0.468
+0.022
5.01%
jan 1, 2010
0.234
-0.234
-50.06%
jan 1, 2011
0.149
-0.085
-36.3%
jan 1, 2012
0.176
+0.027
17.88%
jan 1, 2013
0.058
-0.117
-66.82%
Ranking of countries by current statistics by years