Download This statistics in other country:
Timeline:
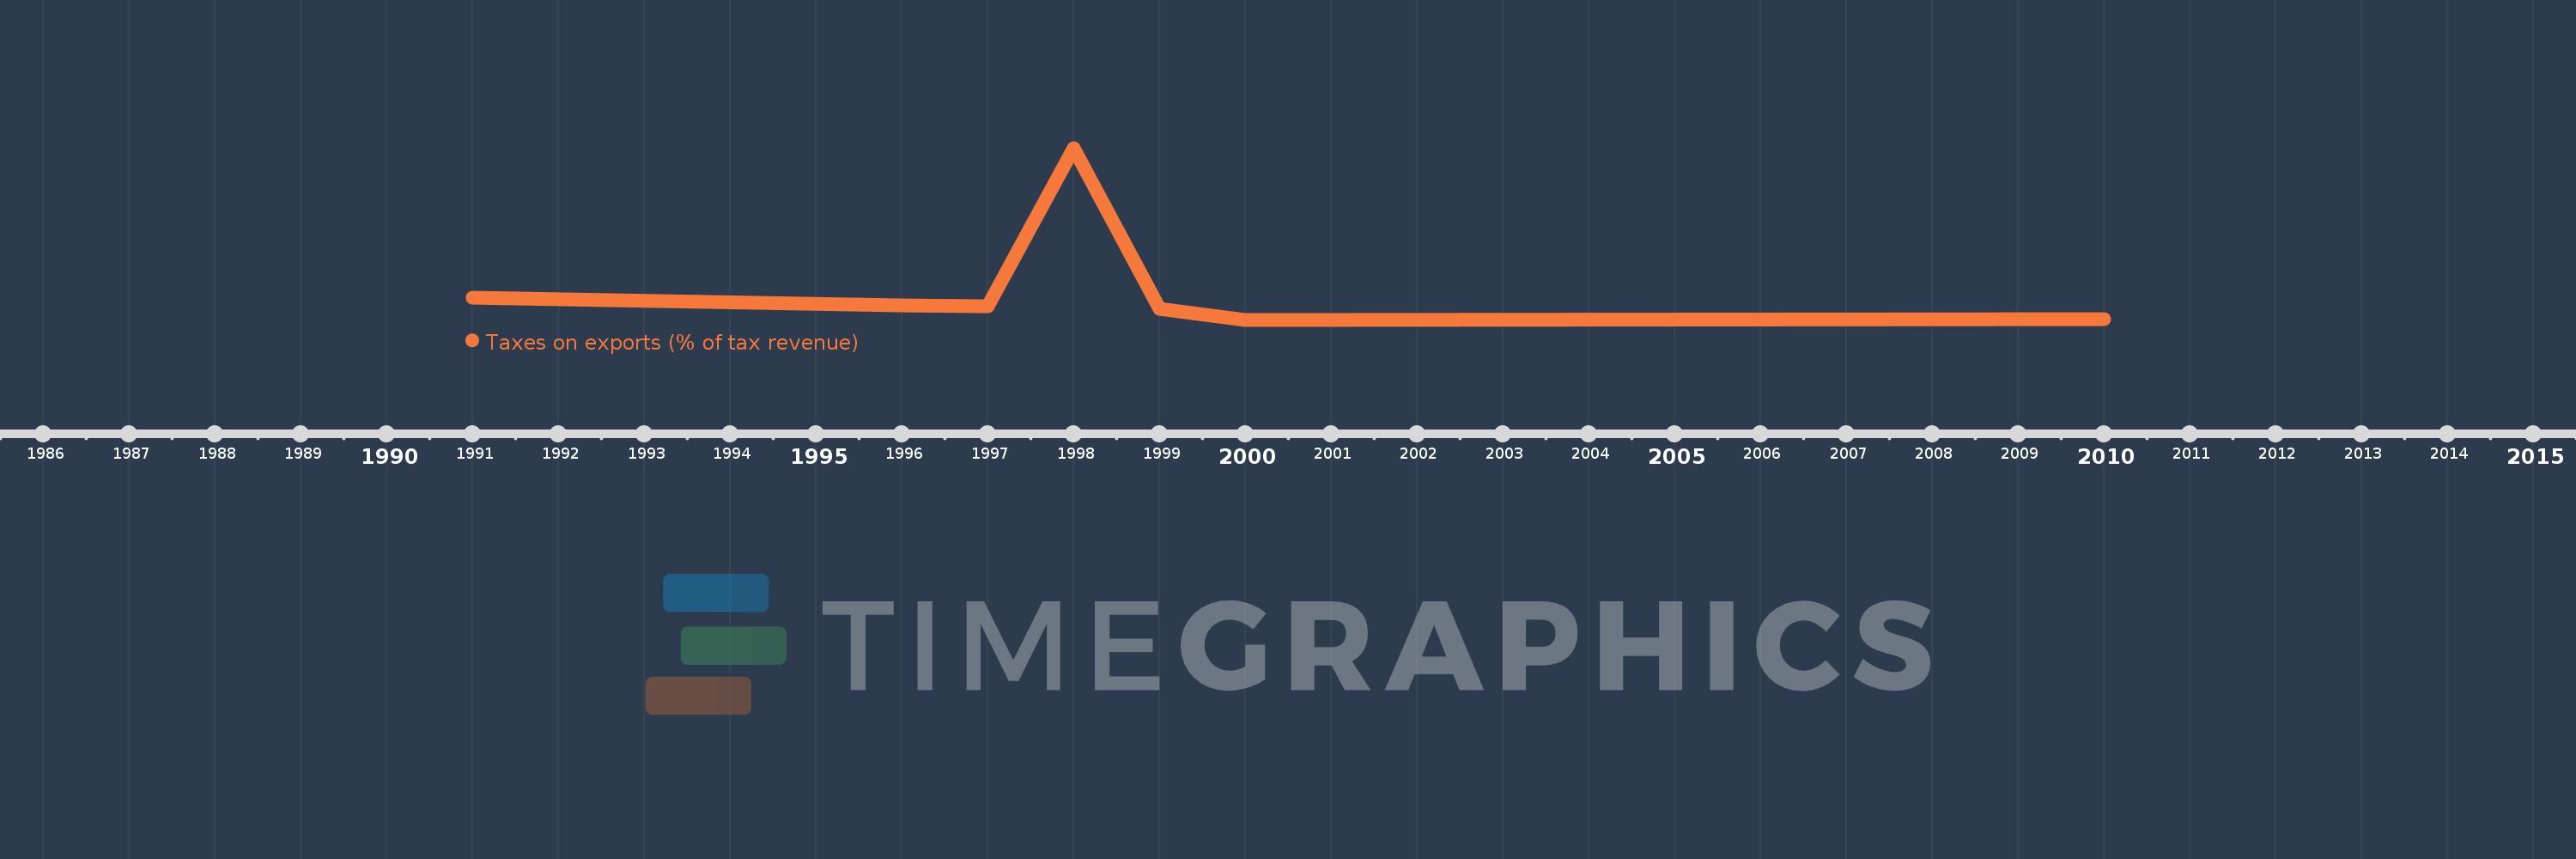
This timeline shows a graph from 1991 to 2010 of Vanuatu. No data until 1990. Number of actual observations by date: 7.
Source name:
World Development Indicators
Source organization:
International Monetary Fund, Government Finance Statistics Yearbook and data files.
Categories, topics:
Public Sector, Trade
Last updated:
apr 23, 2017
Indicators value changes by year
Maximum:
19.587
jan 1, 1998
At the date of observation
Value
Absolute change
Change from the previous value
jan 1, 1991
2.581
+2.581
0.0%
jan 1, 1996
1.699
-0.883
-34.19%
jan 1, 1997
1.549
-0.15
-8.81%
jan 1, 1998
19.587
+18.038
1.16K%
jan 1, 1999
1.298
-18.289
-93.37%
jan 1, 2000
0.034
-1.264
-97.4%
jan 1, 2010
0.077
+0.043
127.08%
Ranking of countries by current statistics by years