Download This statistics in other country:
Timeline:
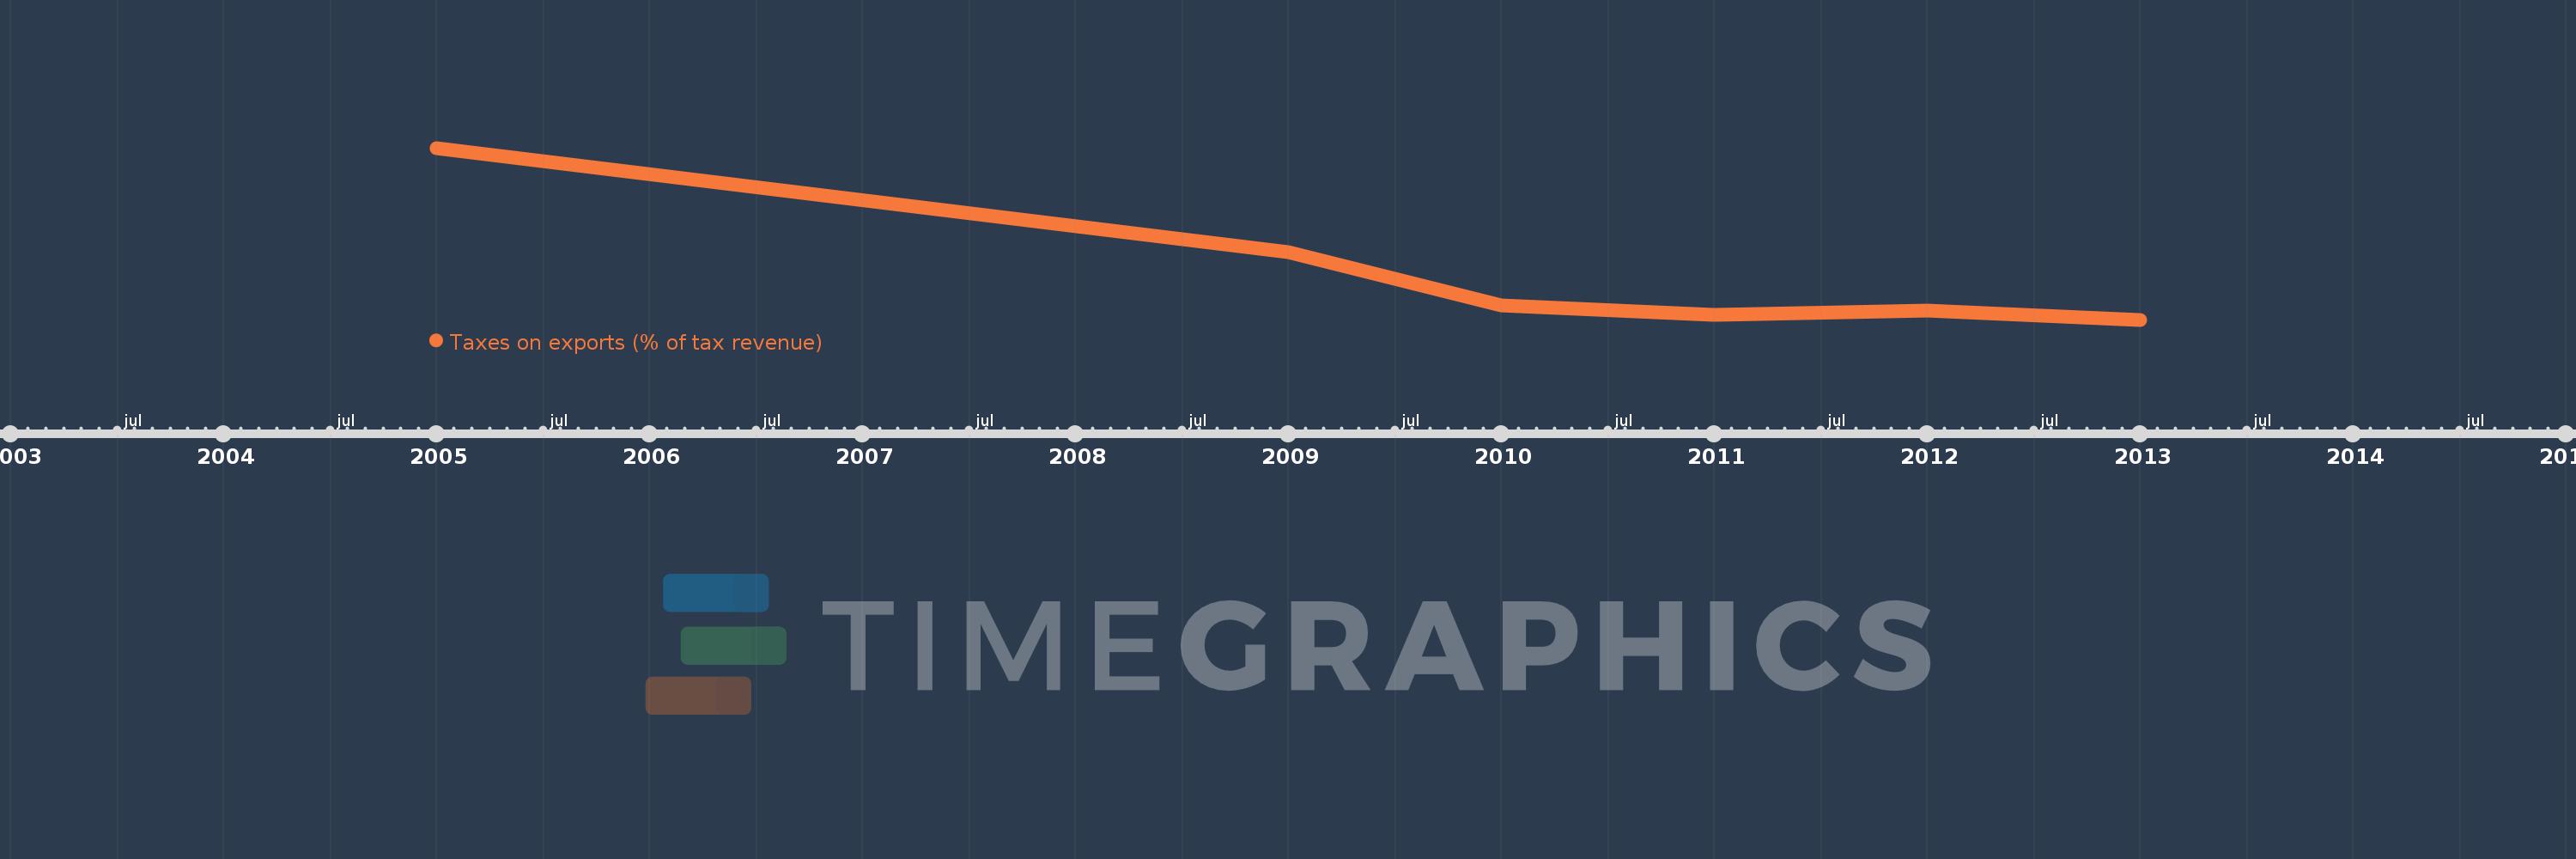
This timeline shows a graph from 2005 to 2013 of Central African Republic. No data until 2004. Number of actual observations by date: 6.
Source name:
World Development Indicators
Source organization:
International Monetary Fund, Government Finance Statistics Yearbook and data files.
Categories, topics:
Public Sector, Trade
Last updated:
apr 23, 2017
Indicators value changes by year
At the date of observation
Value
Absolute change
Change from the previous value
jan 1, 2005
8.299
+8.299
0.0%
jan 1, 2009
4.544
-3.755
-45.24%
jan 1, 2010
2.64
-1.904
-41.9%
jan 1, 2011
2.297
-0.343
-13.01%
jan 1, 2012
2.451
+0.154
6.7%
jan 1, 2013
2.125
-0.325
-13.28%
Ranking of countries by current statistics by years