Download This statistics in other country:
Timeline:
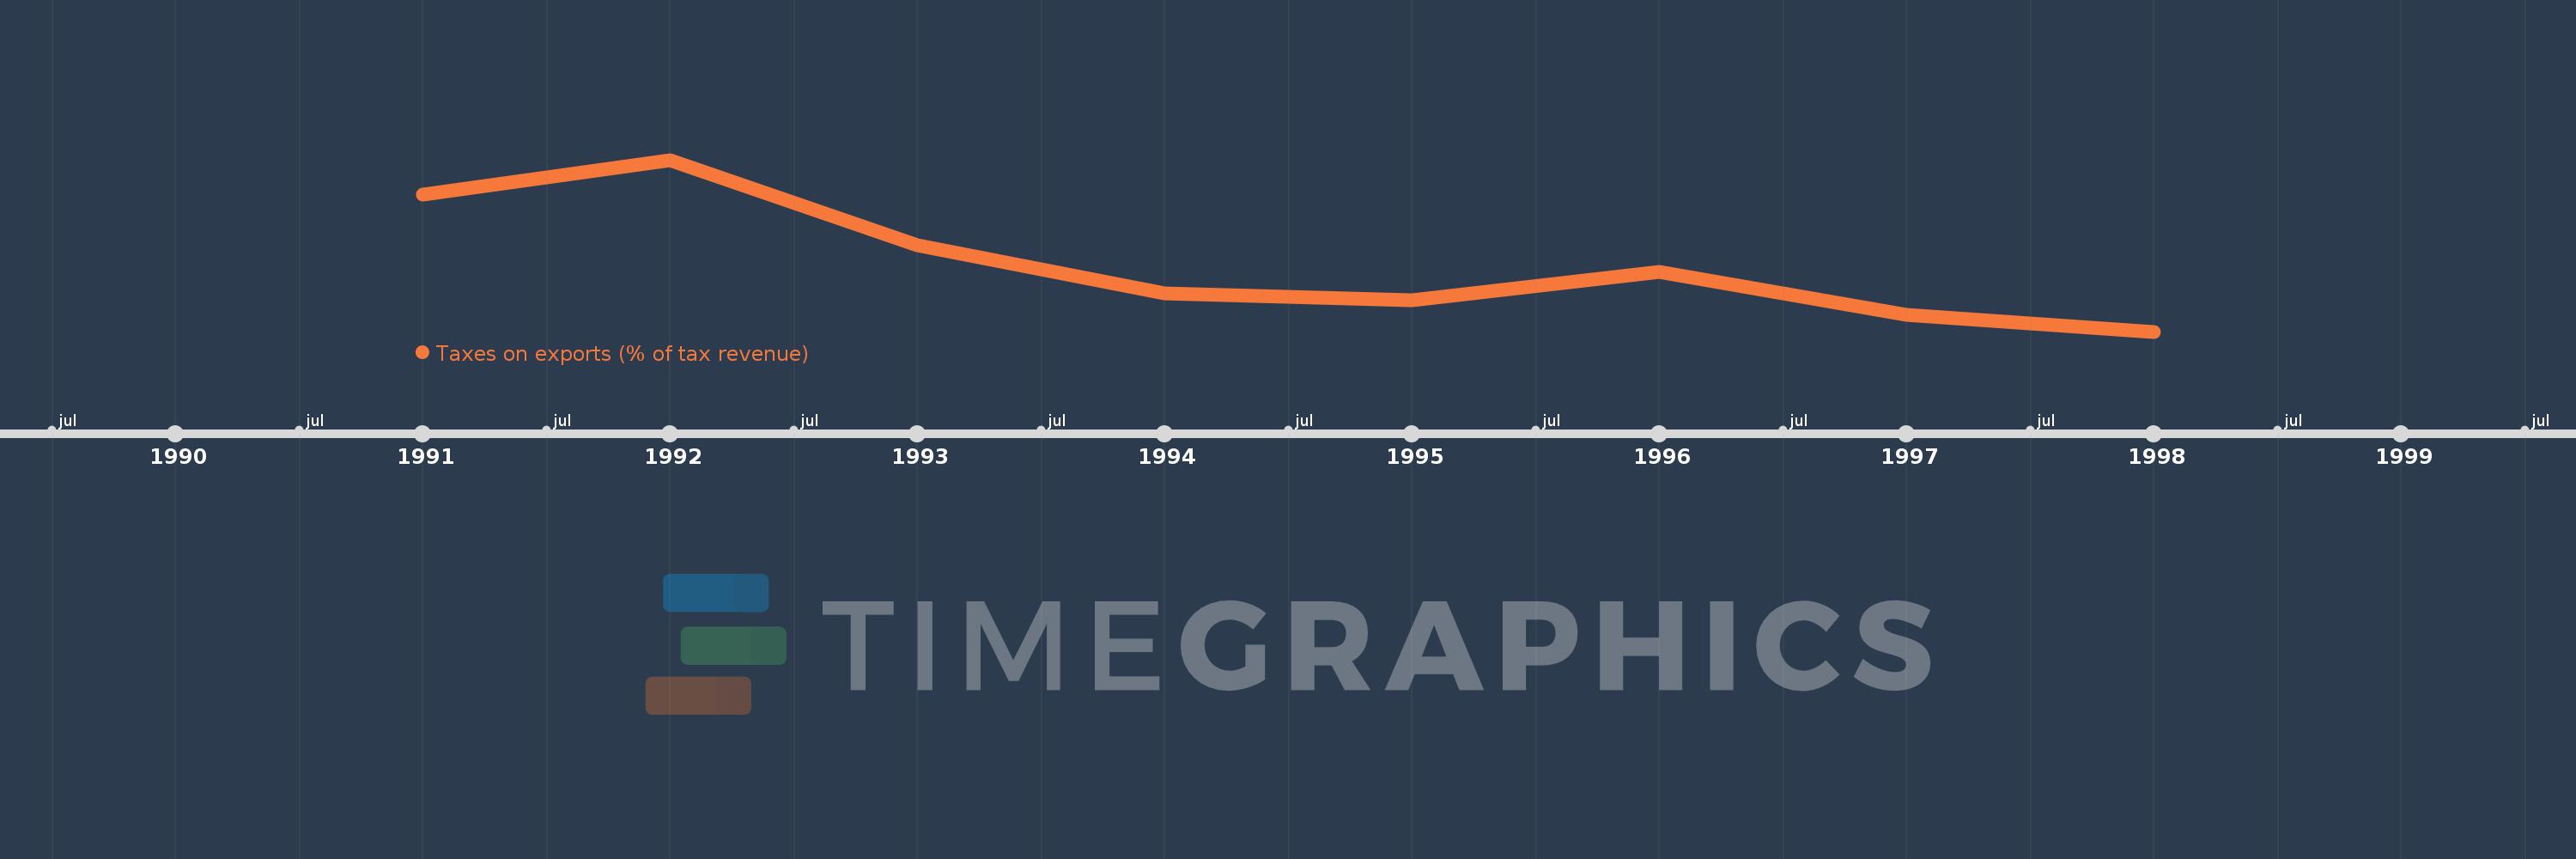
This timeline shows a graph from 1991 to 1998 of Madagascar. No data until 1990. Number of actual observations by date: 8.
Source name:
World Development Indicators
Source organization:
International Monetary Fund, Government Finance Statistics Yearbook and data files.
Categories, topics:
Public Sector, Trade
Last updated:
apr 23, 2017
Indicators value changes by year
Maximum:
10.533
jan 1, 1992
At the date of observation
Value
Absolute change
Change from the previous value
jan 1, 1991
8.498
+8.498
0.0%
jan 1, 1992
10.533
+2.034
23.94%
jan 1, 1993
5.474
-5.059
-48.03%
jan 1, 1994
2.64
-2.834
-51.77%
jan 1, 1995
2.222
-0.418
-15.85%
jan 1, 1996
3.917
+1.695
76.31%
jan 1, 1997
1.361
-2.556
-65.26%
jan 1, 1998
0.397
-0.964
-70.83%
Ranking of countries by current statistics by years