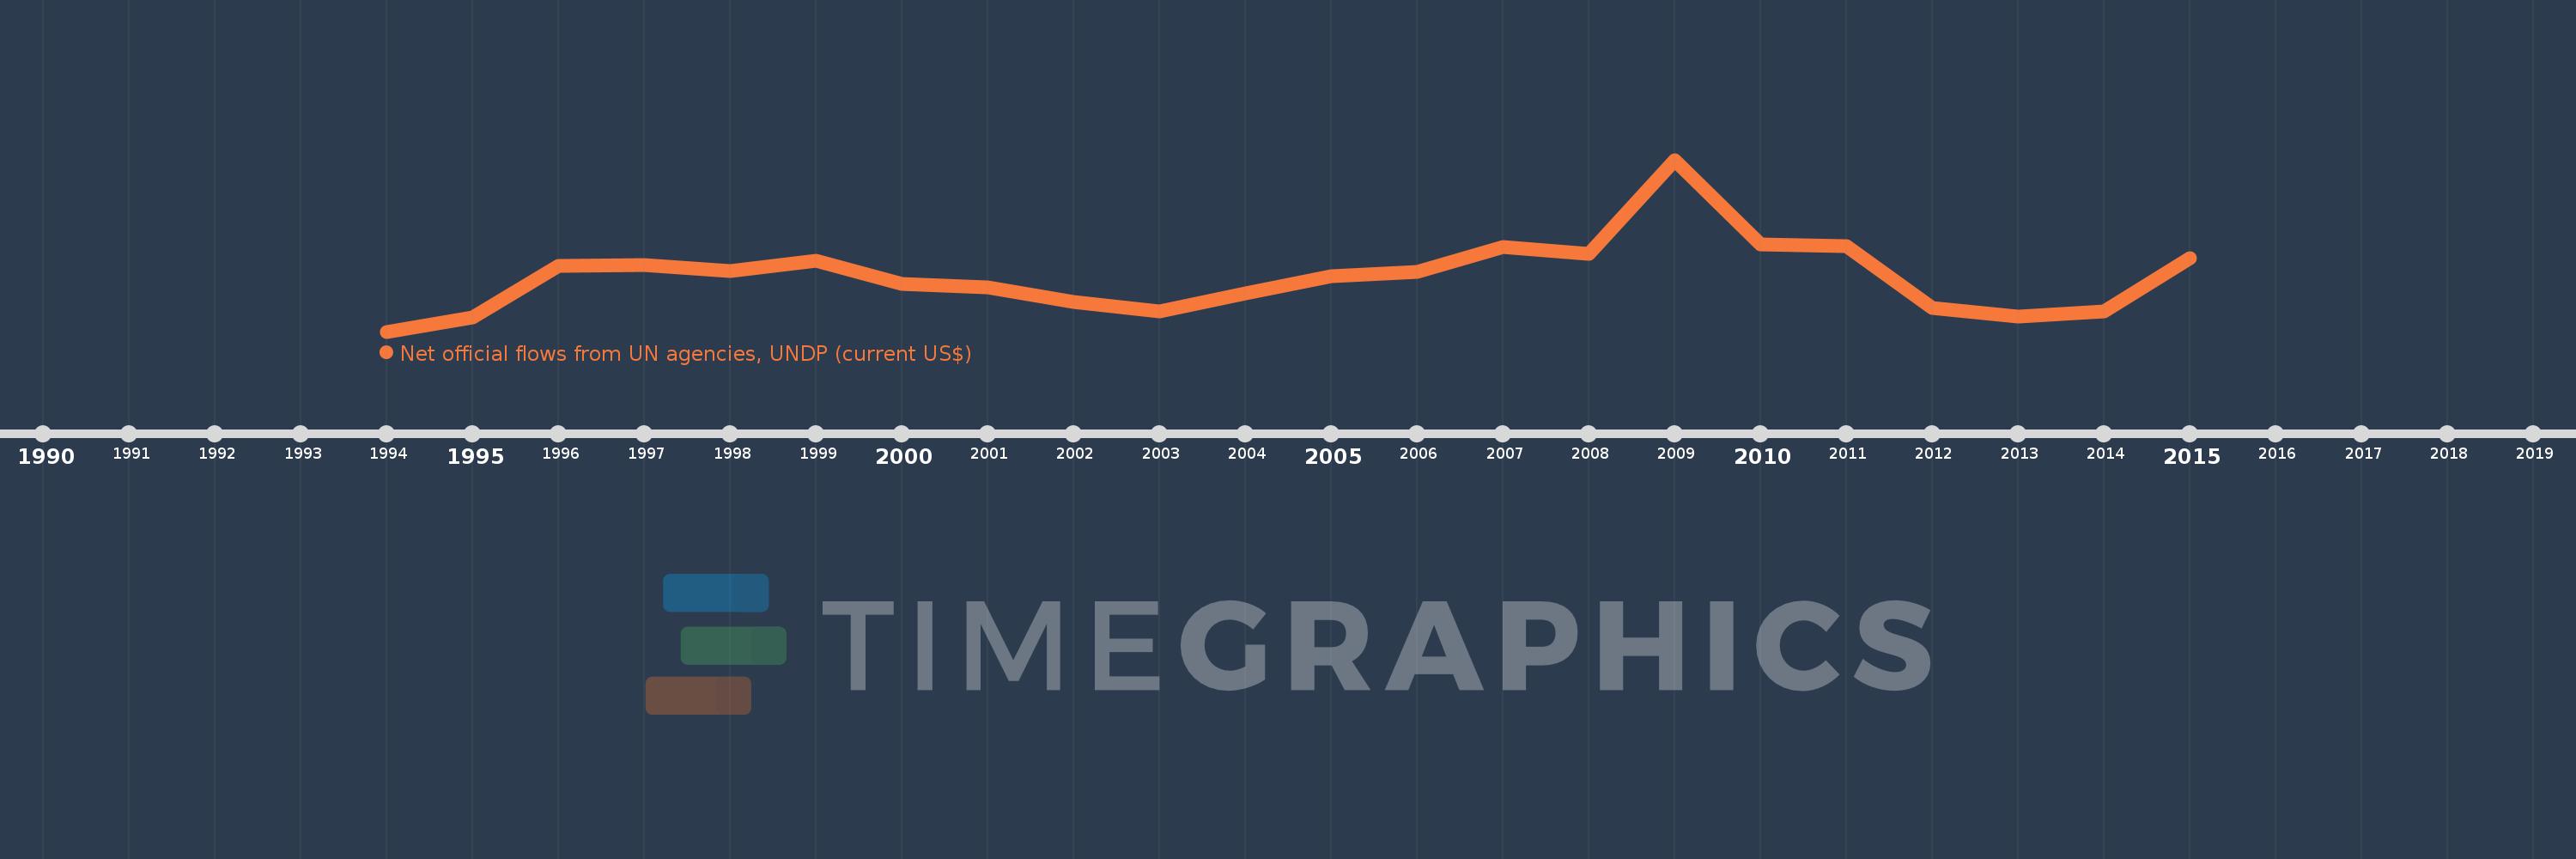
This timeline shows a graph from 1994 to 2015 of Belarus. No data until 1993. Number of actual observations by date: 22.
Source name:
World Development Indicators
Source organization:
Development Assistance Committee of the Organisation for Economic Co-operation and Development, Geographical Distribution of Financial Flows to Developing Countries, Development Co-operation Report, and International Development Statistics database. Data are available online at: www.oecd.org/dac/stats/idsonline.
Categories, topics:
Aid Effectiveness
Last updated:
apr 23, 2017
Indicators value changes by year
Meaning:
549.091K
Minimum:
30.0K
jan 1, 1994
Maximum:
1.65 mln
jan 1, 2009
At the date of observation
Value
Absolute change
Change from the previous value
jan 1, 1994
30.0K
+30.0K
0.0%
jan 1, 1995
160.0K
+130.0K
433.33%
jan 1, 1996
650.0K
+490.0K
306.25%
jan 1, 1997
660.0K
+10.0K
1.54%
jan 1, 1998
600.0K
-60.0K
-9.09%
jan 1, 1999
700.0K
+100.0K
16.67%
jan 1, 2000
480.0K
-220.0K
-31.43%
jan 1, 2001
450.0K
-30.0K
-6.25%
jan 1, 2002
310.0K
-140.0K
-31.11%
jan 1, 2003
220.0K
-90.0K
-29.03%
jan 1, 2004
390.0K
+170.0K
77.27%
jan 1, 2005
550.0K
+160.0K
41.03%
jan 1, 2006
590.0K
+40.0K
7.27%
jan 1, 2007
830.0K
+240.0K
40.68%
jan 1, 2008
760.0K
-70.0K
-8.43%
jan 1, 2009
1.65 mln
+890.0K
117.11%
jan 1, 2010
850.0K
-800.0K
-48.48%
jan 1, 2011
840.0K
-10.0K
-1.18%
jan 1, 2012
250.0K
-590.0K
-70.24%
jan 1, 2013
170.0K
-80.0K
-32.0%
jan 1, 2014
220.0K
+50.0K
29.41%
jan 1, 2015
720.0K
+500.0K
227.27%
Ranking of countries by current statistics by years