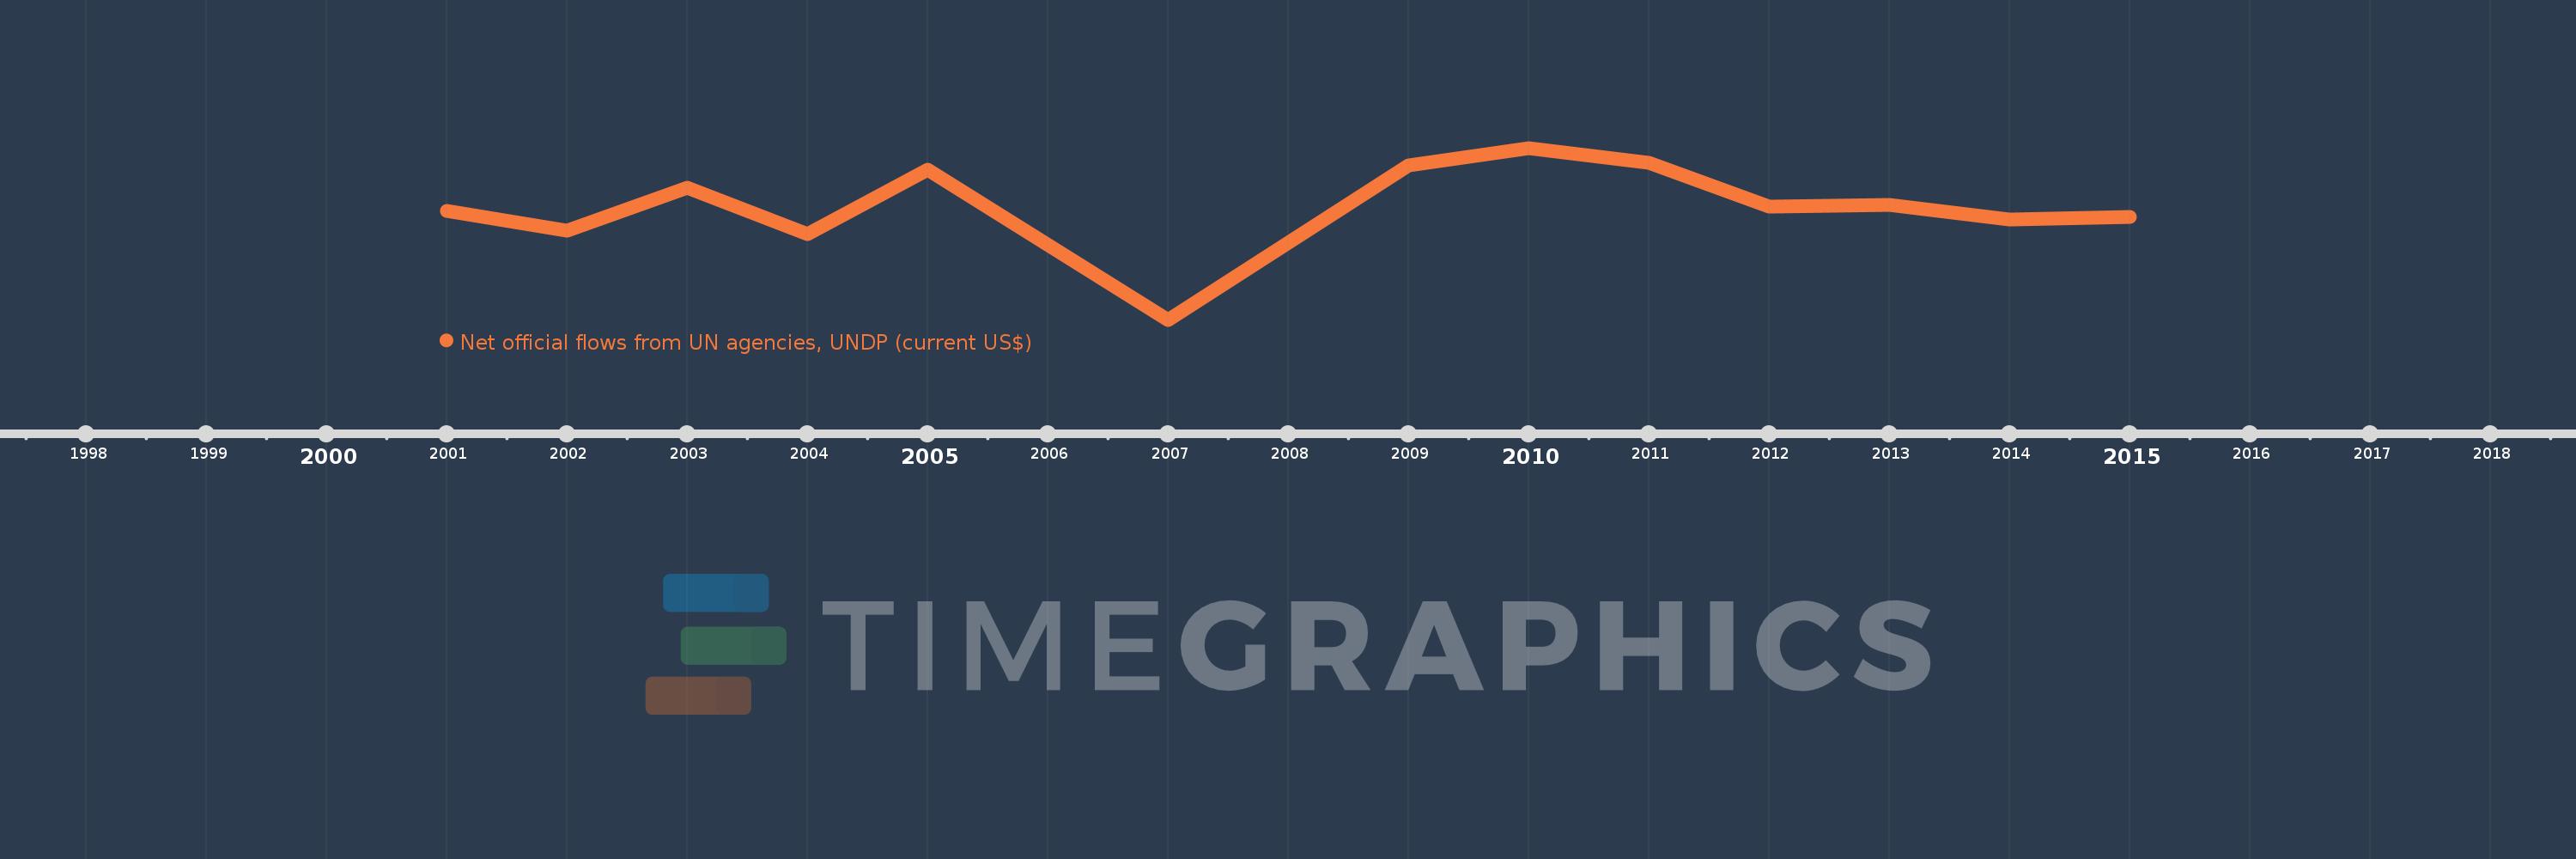
This timeline shows a graph from 2001 to 2015 of West Bank and Gaza. No data until 2000. Number of actual observations by date: 13.
Source name:
World Development Indicators
Source organization:
Development Assistance Committee of the Organisation for Economic Co-operation and Development, Geographical Distribution of Financial Flows to Developing Countries, Development Co-operation Report, and International Development Statistics database. Data are available online at: www.oecd.org/dac/stats/idsonline.
Categories, topics:
Aid Effectiveness
Last updated:
apr 23, 2017
Indicators value changes by year
Meaning:
3.039 mln
Minimum:
30.0K
jan 1, 2007
Maximum:
4.57 mln
jan 1, 2010
At the date of observation
Value
Absolute change
Change from the previous value
jan 1, 2001
2.91 mln
+2.91 mln
0.0%
jan 1, 2002
2.38 mln
-530.0K
-18.21%
jan 1, 2003
3.52 mln
+1.14 mln
47.9%
jan 1, 2004
2.3 mln
-1.22 mln
-34.66%
jan 1, 2005
3.99 mln
+1.69 mln
73.48%
jan 1, 2007
30.0K
-3.96 mln
-99.25%
jan 1, 2009
4.1 mln
+4.07 mln
13.57K%
jan 1, 2010
4.57 mln
+470.0K
11.46%
jan 1, 2011
4.17 mln
-400.0K
-8.75%
jan 1, 2012
3.03 mln
-1.14 mln
-27.34%
jan 1, 2013
3.07 mln
+40.0K
1.32%
jan 1, 2014
2.69 mln
-380.0K
-12.38%
jan 1, 2015
2.75 mln
+60.0K
2.23%
Ranking of countries by current statistics by years