33
/
AIzaSyB4mHJ5NPEv-XzF7P6NDYXjlkCWaeKw5bc
November 1, 2025
180234
Libya
LBY
true
2
1
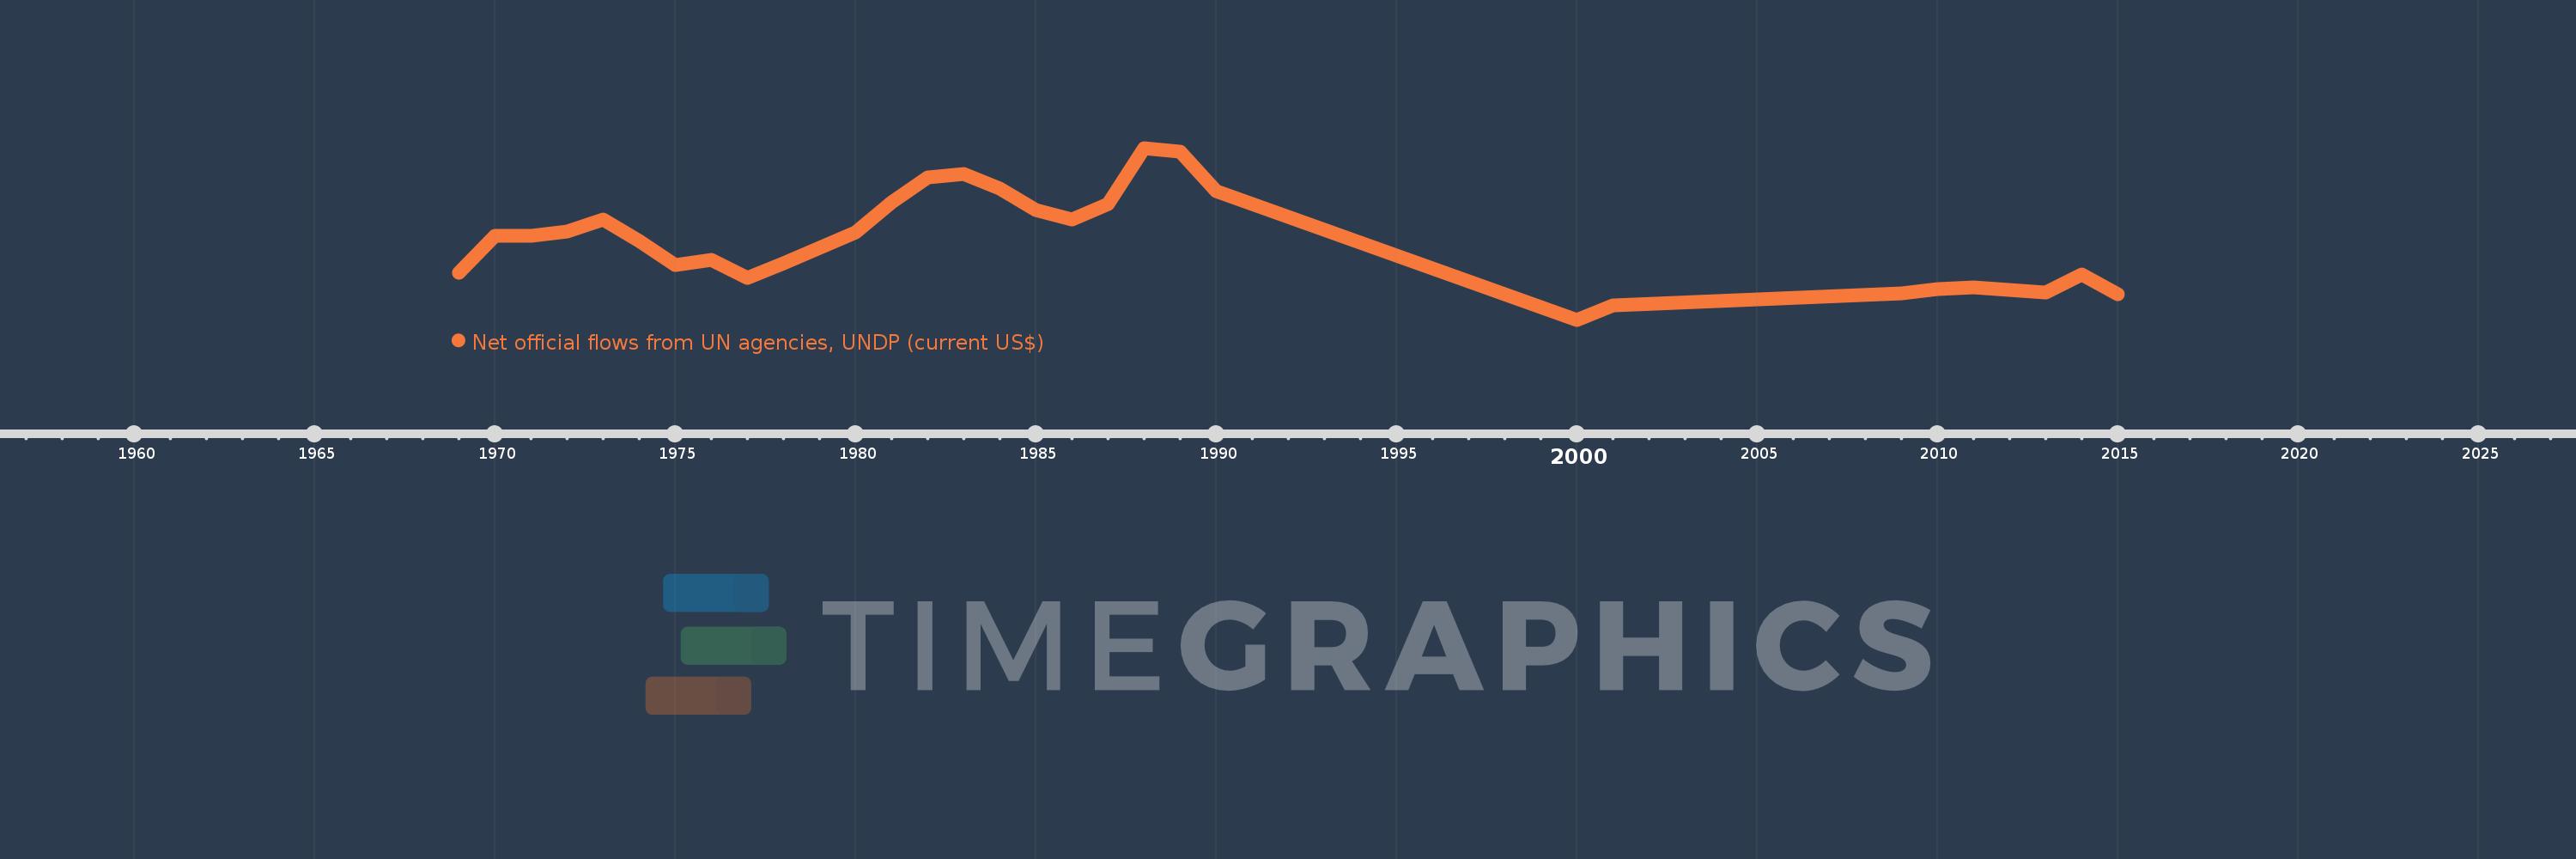
Net official flows from UN agencies, UNDP (current US$)
2015,2014,2013,2011,2010,2009,2001,2000,1990,1989,1988,1987,1986,1985,1984,1983,1982,1981,1980,1979,1978,1977,1976,1975,1974,1973,1972,1971,1970,1969