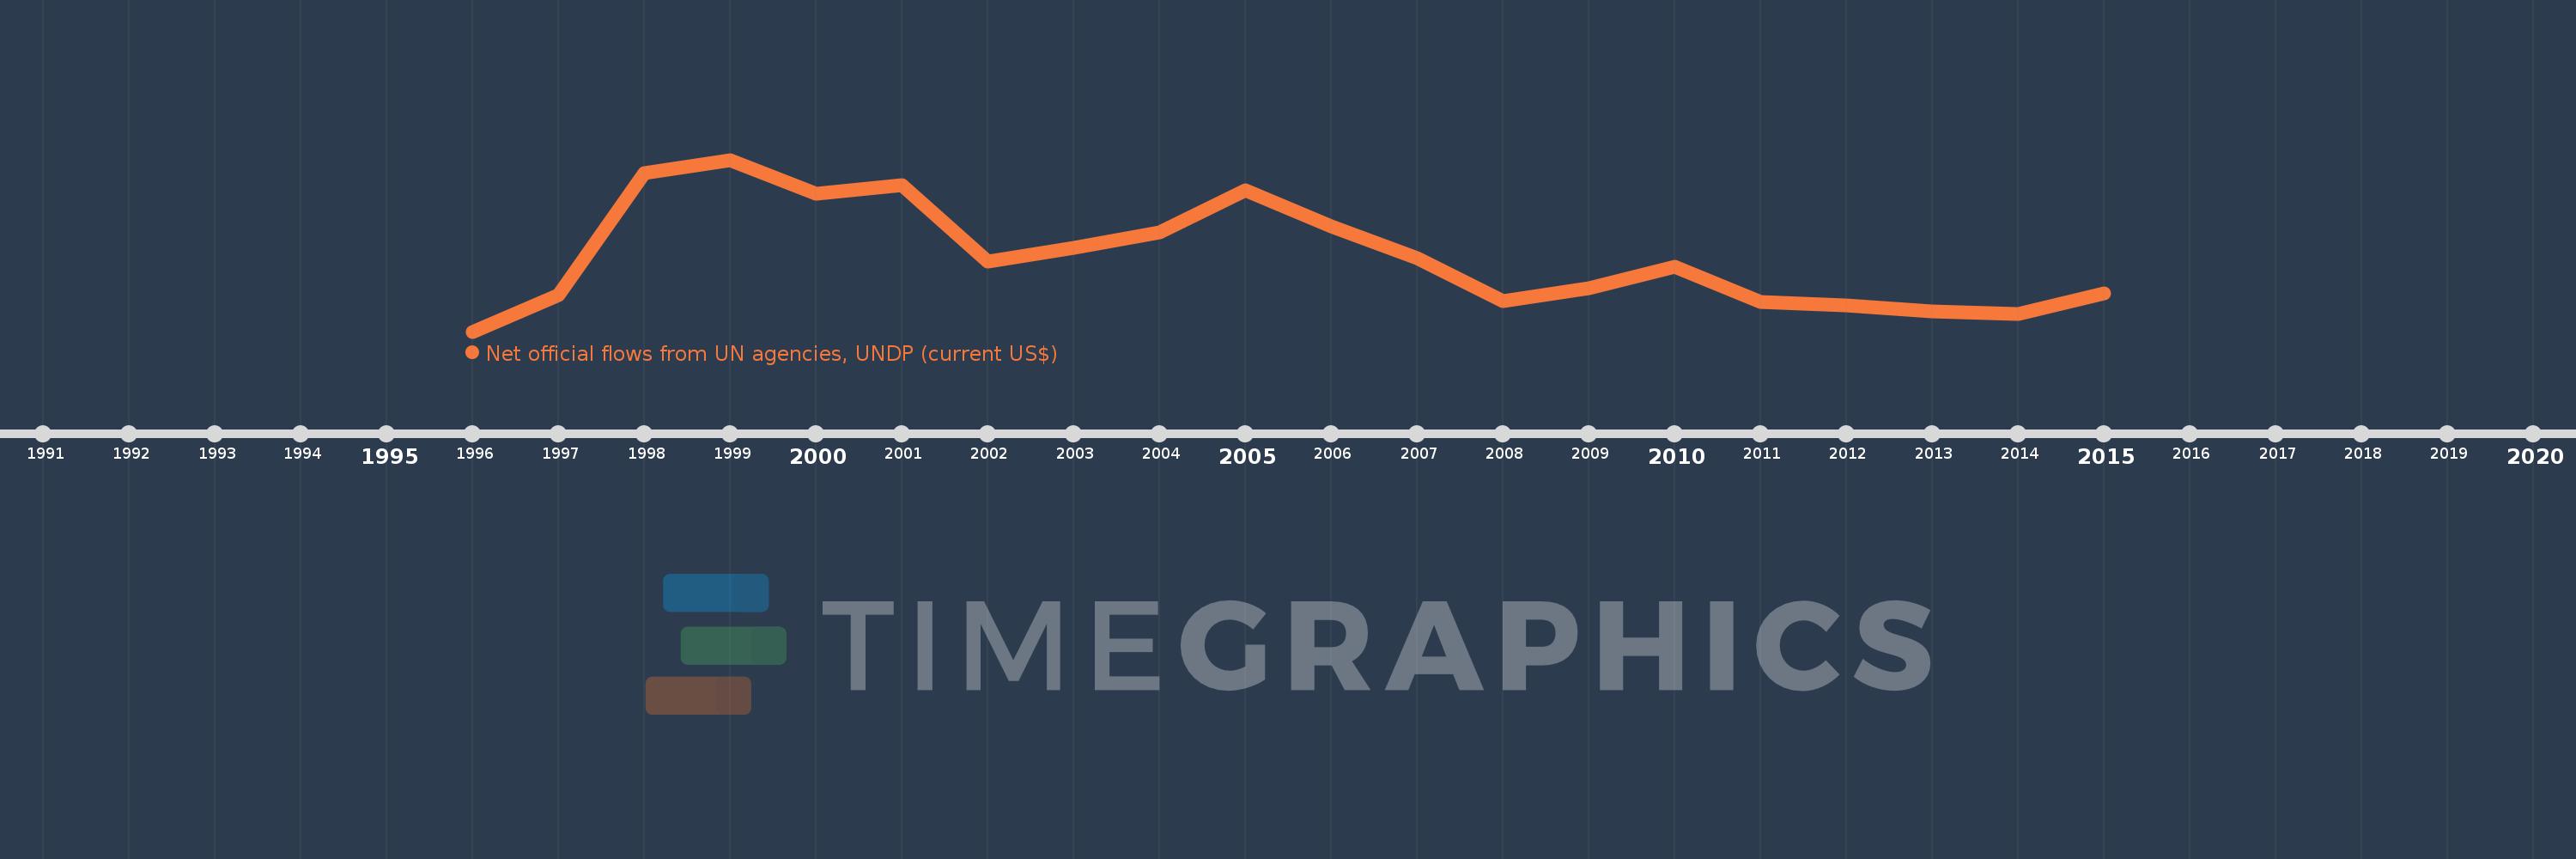
This timeline shows a graph from 1996 to 2015 of South Africa. No data until 1995. Number of actual observations by date: 20.
Source name:
World Development Indicators
Source organization:
Development Assistance Committee of the Organisation for Economic Co-operation and Development, Geographical Distribution of Financial Flows to Developing Countries, Development Co-operation Report, and International Development Statistics database. Data are available online at: www.oecd.org/dac/stats/idsonline.
Categories, topics:
Aid Effectiveness
Last updated:
apr 23, 2017
Indicators value changes by year
Meaning:
1.635 mln
Minimum:
30.0K
jan 1, 1996
Maximum:
3.72 mln
jan 1, 1999
At the date of observation
Value
Absolute change
Change from the previous value
jan 1, 1996
30.0K
+30.0K
0.0%
jan 1, 1997
810.0K
+780.0K
2.6K%
jan 1, 1998
3.43 mln
+2.62 mln
323.46%
jan 1, 1999
3.72 mln
+290.0K
8.45%
jan 1, 2000
3.0 mln
-720.0K
-19.35%
jan 1, 2001
3.17 mln
+170.0K
5.67%
jan 1, 2002
1.54 mln
-1.63 mln
-51.42%
jan 1, 2003
1.83 mln
+290.0K
18.83%
jan 1, 2004
2.16 mln
+330.0K
18.03%
jan 1, 2005
3.06 mln
+900.0K
41.67%
jan 1, 2006
2.29 mln
-770.0K
-25.16%
jan 1, 2007
1.61 mln
-680.0K
-29.69%
jan 1, 2008
690.0K
-920.0K
-57.14%
jan 1, 2009
960.0K
+270.0K
39.13%
jan 1, 2010
1.42 mln
+460.0K
47.92%
jan 1, 2011
660.0K
-760.0K
-53.52%
jan 1, 2012
590.0K
-70.0K
-10.61%
jan 1, 2013
460.0K
-130.0K
-22.03%
jan 1, 2014
410.0K
-50.0K
-10.87%
jan 1, 2015
860.0K
+450.0K
109.76%
Ranking of countries by current statistics by years